Aliased Jitter Spectrum
Instrument:
N1000A-PLK
N109X-PLK
Flex Apps:
FlexDCA
Meas. mode:
Jitter
Waveform type:
PAM4
NRZ
Package License:
L-RND
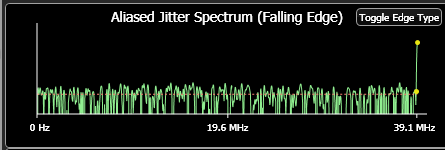
 The aliased jitter spectrum graph provides additional insights into the measurements performed in Jitter Mode. It is a qualitative tool only; the frequency spectrum is aliased and the vertical axis is not labeled. The peaks on the graph that have been identified as periodic jitter are marked with yellow dots.
On the graph for a PAM waveform, repeatedly click the Cycle Edge button to cycle through the waveform edge (Rising or Falling) on which the histogram is based. For NRZ waveforms, the graph is based on rising edges. Because this is the only graph for which you can select to be based on an edge, the is no global graph setting.