Composite DDJ Histogram
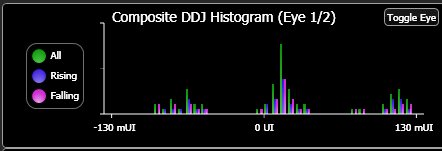
 The Composite DDJ (Data-Dependent Jitter) Histogram shows three histograms of correlated jitter based on data from all edges, rising edges, and falling edges. The peak-to-peak spread of the all-edges histogram represents the DDJ. The peak-to-peak spread of the rising-edges histogram or the falling-edges histogram, whichever is greater, represents Inter-Symbol Interference (ISI). The difference between the mean of the rising edge positions and the mean of the falling edge positions represents the Duty Cycle Distortion (DCD). The graph's horizontal axis indicates negative (–) time for samples that occur earlier than expected and positive (+) time for samples that occur later than expected.
For a PAM waveform, on the graph repeatedly click the Cycle Eye button to cycle through the waveform eye on which the histogram is based. For NRZ waveforms, which only have one eye defined by two levels, there is no selection. To globally specify the PAM eye for all affected graphs:
- Click Measure > Configure Jitter Mode Measurements to open the dialog.
- In the dialog, select the Jitter Measurements tab.
- In the Show Graphs Based on field, select the desired eye.
The global setting effects all Time graphs except RJ/PJ and Aliased Jitter Spectrum.