Time Toolbar
Instrument:
N1000A-PLK
N109X-PLK
Flex Apps:
FlexDCA
Meas. mode:
Jitter
Waveform type:
PAM4
NRZ
Package License:
L-RND
Jitter mode displays a set of default graphs at the top of the screen. To select which time-analysis graphs are displayed, click the graph buttons that are found on the Time Toolbar. Click the following selections to learn about each available graph.
Measurement results are not reported until a significant sample size of data is acquired. Click Measure > Configure Jitter Mode Measurements to configure the measurements.
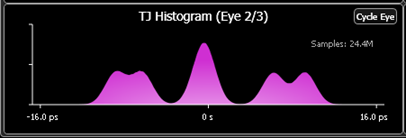
For PAM4 signals, many jitter graphs can be based on a specific eye. To change the eye that is graphed, do one of the following:
- Click the graph's Cycle Eye button.
- Change the Graphs Based on setting in the Jitter Measurements tab of the Configure Jitter Measurements dialog.


