|
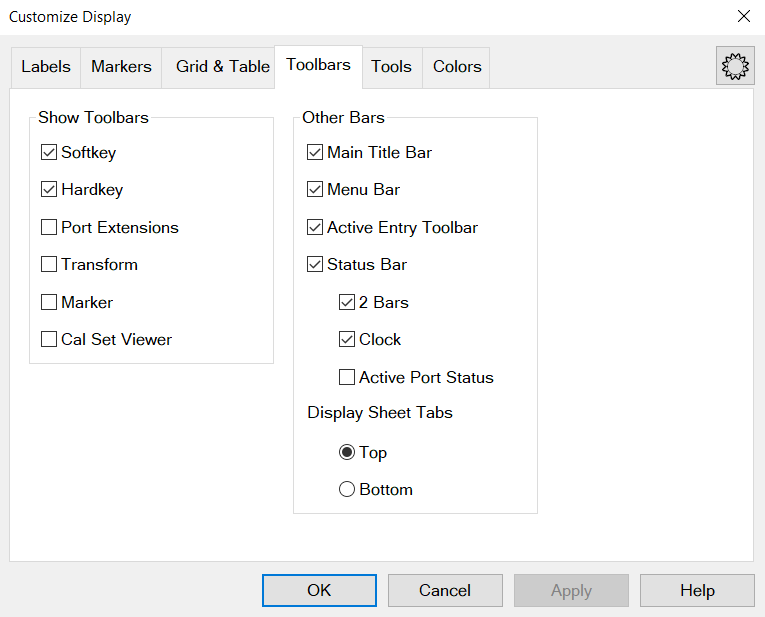
Show Toolbar
Note: There is also a Cal Set toolbar available for Monitoring Error Terms
Softkey
Softkey is a combination of softkeys and SoftTabs. Softkeys are automatically turned ON when one of the 'function' hardkeys is pressed. This setting allows you to turn the softkeys OFF to show more measurement space on the screen. The softkeys will reappear when another function hardkey is pressed.
Hardkey
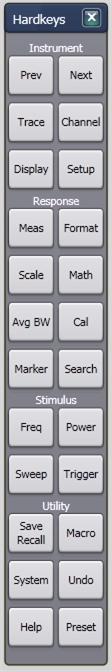
These keys also known as Front Keys, perform interface operations that are equivalent to those of keys in the INSTRUMENT keys, RESPONSE keys, STIMULUS keys and UTILITY keys on the front panel of VNA. Learn more.
Port Extensions Toolbar

The Port Extension toolbar allows you to set Port Extensions while viewing the measurement trace. Learn more about Port Extensions.
Transform (Time Domain) Toolbar

The Time Domain toolbar allows you to do the following:
-
Turn Transform and Gating ON/OFF.
-
Change the Start/Stop times for both Transform and Gating.
-
More... - Launches the Time Domain Transform dialog box.
-
? - Display the help file.
-
X - Closes the toolbar.
Markers Toolbar

The markers toolbar allows you to set up and modify markers. It shows:
-
Marker number
-
Stimulation value
-
Marker functions:
-
-
Delta
-
Max/Min
-
Start/Stop
-
Center/Span
Tip: To use the Front Panel Knob to change marker position, first click the Stimulus field of the marker toolbar and then turn the knob.
Learn more about Markers
Cal Set Viewer Toolbar

Learn more about Cal Set Viewer.
All Off (NOT on softkeys)
This allows you to hide all toolbars with a single selection. NOT available on sofkeys.
Other Bars
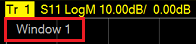
Main Title

The Main Title shows the title of VNA window and Minimize / Maximize icons.
Active Entry Toolbar

When used with softkeys, this area allows numeric values to be entered for settings. From the keyboard, enter G for Giga, M for Mega or milli, K for kilo and so forth.
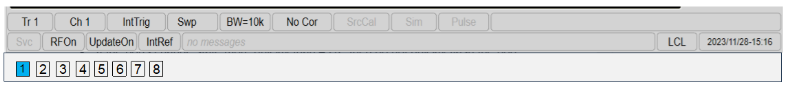
Status Bar
2 Bars

When enabled, the status bar is displayed along the bottom of the VNA screen. The primary status bar shows the following:
Tip: Right-click on many of these items in the status bar for quick access to settings.
Note: A second level status bar appears when using External Test Set Control or Interface control.
The status bar state (ON or OFF) will not change when the VNA is Preset.
Clock (System Date and Time)
The VNA system date and time can be shown in the far right corner of the status bar.
The format is: year-month-day hr:min and can NOT be changed.
To hide the clock, right click the mouse on the clock and then click Hide Clock.
Learn how to set the VNA time settings.
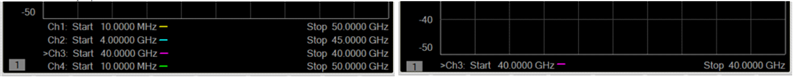
Active Port
Check to enable the active port feature. All VNA port numbers will be displayed in a status bar whether they are active or not. The currently active port will be highlighted in blue.
If the ports change state more quickly than 4 Hz in standard channel, all active ports will be highlighted with a constant blue color.
The location of the active port indicators depend on the state of the "2 Bars" selection, the number of VNA ports and the width of the display.
Selecting Measurement Class other than Standard will disable the Active Port Pane. If both Application and Standard measurement channels are selected, the indications for Standard channel will only be shown on the pane.
Use-Case example:
1. "2 Bars" is OFF. The active port indicators on 2nd bar.

2. "2 Bars" is ON. The active port indicators on 1st bar.

3. "2 Bars" is ON. The active port indicators on 3rd bar. (when number of port indicators > (Wapp-1000)/20, where Wapp is application width in pixels.)
Display Sheet Tabs
Top - Display sheet tabs above display.
Bottom - Display sheet tabs below display.
|