:TRACe Subsystem
Use the TRACe subsystem commands in TDR/TDT Mode to create traces for displaying T-domain parameters and S-parameters. This includes specifying the waveform content window in which to display the trace. Traces can be displayed in Oscilloscope, Eye/Mask, and TDR modes. Up to 128 traces can be defined. Click here to learn important information about content windows and window axis scaling.
This subsystem Requires FlexDCA revision A.04.00 and above.
Waveform data for T-domain parameters and S-parameters are written in traces, which are then displayed in and scaled to waveform content windows. Use the :TRACe subsystem for tasks such as:
- Creating a trace
- Assigning a T-domain parameters and S-parameter to the trace
- Selecting a color for the displayed trace
- Displaying the trace
Trace Position and Scaling
A trace's X and Y-axis position and scaling is linked to and set from the :GRAPh subsystem. The only exception is for T-domain parameters (shown in Time-Ohms, Time-Volts, and Time-% content windows). On these traces, the X-axis (time) position and scaling is linked to and set from the :TIMebase subsystem. In other words, the time settings on all time-domain windows are set and controled from the :TIMebase subsystem. For that reason, you can only query X and Y-axis position and scaling in the :TRACe subsystem.
Window Legend
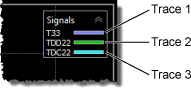
Each waveform content window includes a legend which identifies the trace as shown in this picture. Up to 128 traces can be defined. To show or hide the legend use the following commands:
:DISPlay:WINDow:TDLegendcommand for time-domain content windows (Time-Ohms, Time-Volts, and Time-%):DISPlay:WINDow:FDLegendcommand for frequency-domain content windows (Freq-Mag, GrpDelay, and Phase)
Example 1
The following sequence of commands shows how to create 6 traces to display a T-domain parameter (T11) and an S-parameter (S11), each in three different content windows.
// Create Trace 1 (T11)
:TRACe1:DUT DUT1  //  Select DUT number 1.
:TRACe1:PARameter T1_1  //  Select T11 response.
:TRACe1:OPERator OHMS  //  Display in Time-Ohms content window.
:TRACe1:COLor TCOLor1  //  Select color.
:TRACe1:DISPlay ON  //  Display response.// Create Trace 2 (T11)
:TRACe2:DUT DUT1
:TRACe2:PARameter T1_1
:TRACe2:OPERator VOLTs  //  Display in Time-Volts content window.
:TRACe2:COLor TCOLor2
:TRACe2:DISPlay ON

// Create Trace 3 (T11)
:TRACe3:DUT DUT1
:TRACe3:PARameter T1_1
:TRACe3:OPERator PERCent  //  Display in Time-% content window.
:TRACe3:COLor TCOLor3
:TRACe3:DISPlay ON

// Create Trace 4 (S11)
:TRACe4:DUT DUT1
:TRACe4:PARameter S1_1
:TRACe4:OPERator MAGNitude  //  Display in Freq-Mag content window.
:TRACe4:COLor TCOLor4
:TRACe4:DISPlay ON

// Create Trace 5 (S11)
:TRACe5:DUT DUT1
:TRACe5:PARameter S1_1
:TRACe5:OPERator PHASe  //  Display in Phase content window.
:TRACe5:COLor TCOLor5
:TRACe5:DISPlay ON

// Create Trace 6 (S11)
:TRACe6:DUT DUT1
:TRACe6:PARameter S1_1
:TRACe6:OPERator GDELay  //  Display in GrpDelay content window.
:TRACe6:COLor TCOLor6
:TRACe6:DISPlay ON
Example 2
To place markers on T-domain and S-parameter traces, identify the trace in the :MARKer subsystem by trace number. For example,:
:TRACe3:PARameter T2_1
:TRACe3:OPERator OHMS
:TRACe3:CWINdow TOHMs2
:TRACe3:DISPlay ON
:MARKer:X1:SOURce TRACe3
:MARKer:X1:STATe MANual  //  Turn on marker
…