Configure Measurements
The instrument must identify basic waveform values, such as top and base, before it can calculate measurements like rise time. To determine these values, the instrument constructs a measurement histogram and locates the waveform's statistical maximum (top) and statistical minimum (base) voltage levels. A measurement histogram is the distribution of how often different voltage levels occur in waveform data.
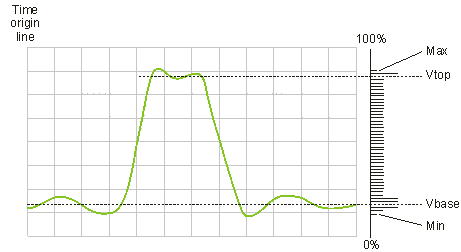
The following basic steps are used to identify waveforms:
- A measurement histogram is constructed.
- The top 40% of the histogram is scanned for the top value. The bottom 40% is scanned for the base value. The center 20% of the histogram is not scanned.
- The instrument decides whether the waveform's maximum and minimum values should be used to determine top and base (for example, when measuring triangle waveforms) or whether the measurement histogram peaks should be used (for example, when measuring square waveforms). This selection technique allows the detection of top and base for low duty cycle waveforms. To assign standard or custom values to the top-base levels, click Measure > Configure Meas and select the Top-Base Definition tab.
- Threshold levels are calculated using the top and base values. To select custom or standard IEEE threshold measurement points, click Measure > Configure Meas and select the Thresholds tab:
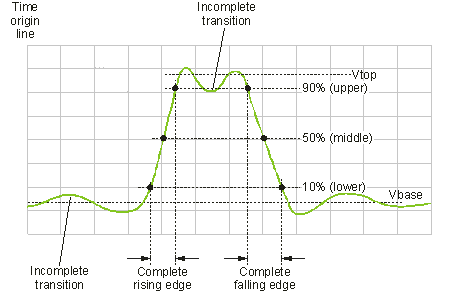
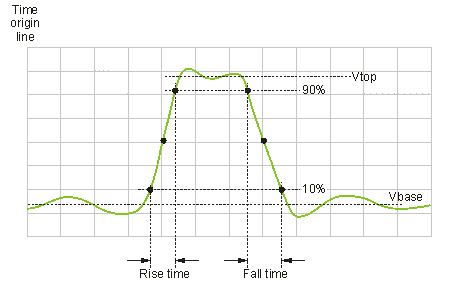
- 10%, 50%, 90% (IEEE Default). This is the default settings which sets IEEE threshold levels of 10%, 50%, and 90% for the respective lower, middle, and upper measurement thresholds. These threshold definitions can be used for normal waveform records.
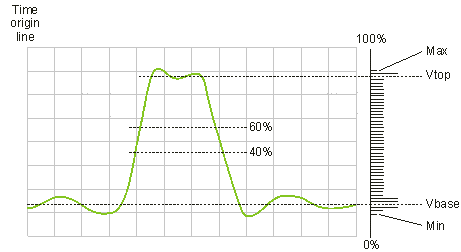
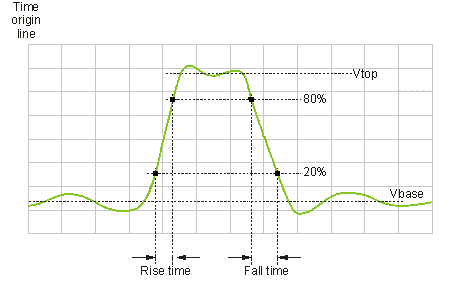
- 20%, 50%, 80%. For waveforms with excessive ringing noise or overshoot, this setting provides better measurement results. The following pictures illustrate the same waveform, each with one of the IEEE threshold definitions applied to the waveform. The waveform's rise and fall times are shorter with the 20%, 50%, 80% threshold setting.
- Custom. Enables you to set up threshold levels and compare different waveform using custom-defined threshold levels.
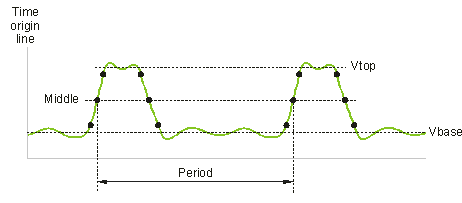
- Rising and Falling Edges are determined. A rising edge is a transition that passes through the lower, middle and upper threshold levels. A falling edge is a transition that passes through the upper, middle and lower threshold levels. An edge must complete the transition through all three threshold levels before it is detected. Rise time and fall times are calculated. The points on a rising edge occur from the last point to cross the lower threshold to the first point crossing the upper threshold. The points on a falling edge occur from the last point to cross the upper threshold to the first point crossing the lower threshold. These points determine the fastest rise and fall times. If there are not enough points on an edge, the measurement is not made or is noted as questionable. If a waveform data point does not exactly correspond to the threshold level value, the instrument interpolates between the two points closest to the threshold. The location of the transition point is recorded in an edge array. The instrument ignores incomplete transitions.
Thresholds are used by all timing measurements as they are needed to determine the presence of a rising or falling edge. In addition, the thresholds are used by various subsequent measurements. For example, rise time is measured from the lower threshold to the upper threshold of a rising edge. Period measurements require that the middle threshold be defined.
