Display Frequency Domain Parameters
Using the Display S-Parameters dialog, you can display multiple Magnitude (Freq-Mag), Phase (Phase), or Group Delay (GrpDelay) charts, which are waveform content windows. To view the S-parameters that are available for your specific TDR setup, click the Available S-Parameters in the TDR Setup dialog. Increasing the number of activated TDR steps increases the number of available parameters. Depending on the TDR stimulus mode, multiple single-ended or differential responses will be available.
| TDR Stimulus Mode | Type of Available Responses | |
|---|---|---|
| Single-Ended | Differential | |
| Single-Ended | ♦ | |
| Differential | ♦ | ♦ |
To Display S-Parameters
- Open the Display S-Parameters dialog by clicking:
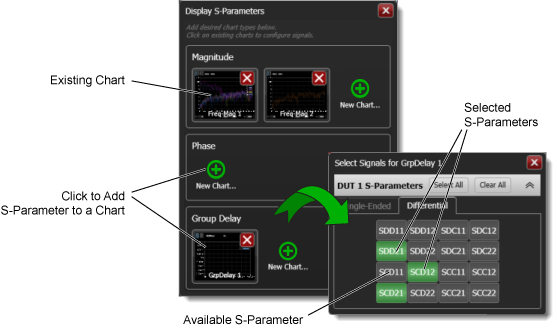
- In the pane, click the
 icon to select an S-parameter for either an existing or new Magnitude (Freq-Mag), Phase (Phase), or Group Delay (GrpDelay) chart.
 - Click to select as many available S-parameters as you want on the chart. Available parameters are highlighted; selected parameters are green. In this picture, there are eight available differential parameters of which three (SDD21, SCD12, and SCD21) are selected for the Magnitude chart. Additional parameters may be available on the Single-Ended tab.
- After the graph is displayed, the graph can be configured.

|
The Display button in the TDR Setup dialog, or |

|
The Freq Domain Displays button in the Setup toolbar. |
The maximum stop frequency that can be shown on an S-Parameter chart is determined by the range of response data captured during the TDR calibration. For certain N1055A TDR modules, an Extended S-Parameter setting is available to capture non-specified data from >50 GHz to 70 GHz. Although the >50 GHz to 70 GHz range has no specification, it can be informative especially when the setup has been calibrated.
Changing the Frequency Spacing
You can change the default frequency spacing between data points on all frequency domain graphs. This is the same frequency spacing between the data points in S-parameter data that is saved to a file.
- Select a displayed frequency domain graph
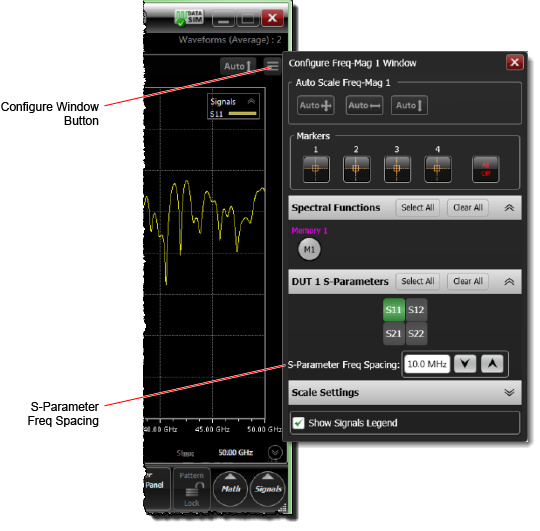
- Click on the Configure Window button shown in the following picture.
- After the graph is displayed, use the Configure Window pane to quickly perform the following tasks:
- View or hide individual S-parameter waveforms.
- Change the S-Parameter Freq Spacing setting.
- Scale the graph's Y-axis.
- Apply tracking markers.