TDR/TDT Concepts
In this topic you'll learn the basics of TDR and TDT measurements, which allow you to evaluate the integrity of a transmission line and its load. The device under test can be a passive device such as a printed circuit board, connector, or cable. Both TDR and TDT measurements may be performed on single-ended or differential circuits. For both TDR and TDT, a fast edge is introduced into your Device Under Test (DUT) and performs the following measurements:
- For TDR, measures the reflection response for comparison of the incident and reflected waves.
- For TDT, measures both insertion loss and propagation delay of your DUT. TDT requires that you connect an electrical channel to the output of your DUT. The incident step at the output of the DUT is then sent into the electrical channel.
TDR uses an echo technique as used in a "closed-loop radar", as shown in the graphic below. The TDR module launches a fast voltage incident step (Ei) into the DUT.
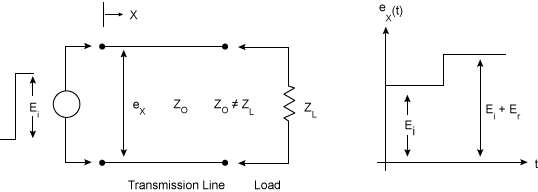
FlexDCA displays both the transmitted and reflected pulse (Er) at any particular point on the transmission line. The following information about the DUT is revealed:
- Characteristic impedance and impedance changes (as a function of distance)
- Percent reflection
- Types of any discontinuities (resistive, inductive, or capacitive)
- Type of loss (series or shunt)
- Propagation delay
Knowing the above characteristics, you can then locate the sources of impedance mismatch that contribute to cross talk, multi-path distortion, signal degradation, and unwanted emissions. TDR also gives more meaningful information concerning the broadband response of a transmission system than any other measurement technique. You'll find many typical measurements, such as rise time, on the measurement toolbar.
When using an 86118A, the long length head cables introduce extra trigger delay that horizontally skews the displayed signal and may result in the display of the transmitted step appearing before the incident step.
Propagation on a Transmission Line
The classic transmission line consists of a continuous structure of resistors (R), inductors (L), and capacitors (C), as shown in the following circuit. By studying this example several characteristics of the transmission line can be determined.

If the line is infinitely long and R, L, G, and C are defined per unit length, then

where Zo is the characteristic impedance of the line.
A voltage introduced at the step generator requires a finite time to travel down the line. The phase of the voltage moving down the line lags behind the voltage introduced at the generator by an amount β per unit length. The voltage is then attenuated by an amount α per unit length by the series resistance and shunt conductance of the line. The phase shift and attenuation are defined by the propagation constant γ in the following equation.

where:
- α is the attenuation in nepers per unit length.
- β is the phase shift in radians per unit length.
The velocity at which the voltage travels down the line can be defined in terms of β, where

The velocity of propagation (Vp) approaches the speed of light (Vc) for transmission lines with air dielectric. For the general case where er is the dielectric constant.

The propagation constant Υ can be used to define both the voltage and current at any distance (x) down an infinitely long line by the following relations:


Since the voltage and the current are related at any point by the characteristic impedance of the line

where:
- Ein is the incident voltage
- Iin is the incident current
The previous equations satisfy the voltage and current relationships when the transmission line is infinite in length and is terminated in a load whose impedance matches the characteristic impedance of the line. If the load is different from Zo, these equations are not satisfied unless a second wave is considered to originate at the load and to propagate back up the line toward the source. This reflected wave is energy that is not delivered to the load. Therefore, the quality of the transmission system is indicated by the ratio of this reflected wave to the incident wave originating at the source. This ratio is called the voltage reflection coefficient, ρ, and is related to the transmission line impedance by the equation:

The magnitude of the steady-state sinusoidal voltage along a line terminated in a load other than Zo varies periodically as a function of distance between a maximum and minimum value. This variation, called a standing wave, is caused by the phase relationship between incident and reflected waves. The ratio of the maximum and minimum values of this voltage is called the voltage standing wave ratio (VSWR), σ, and is related to the reflection coefficient by the equation:

Either of the above coefficients can be measured. However, the value of the VSWR measurement is limited. If a system consists of a connector, a short transmission line and a load, the measured standing wave ratio indicates only the overall quality of the system. This value does not tell which of the system components is causing the reflection or whether the reflection from one component is of such a phase as to cancel the reflection from another component.
TDR Step Reflection Testing
The TDR module applies a positive-going incident wave (step) to the transmission system under test. This step (Ei) travels down the transmission line at the velocity of propagation of the line.
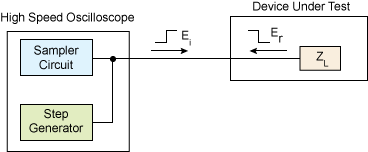
If the load impedance is equal to the characteristic impedance of the transmission line (Er = 0) there is no reflection. The displayed waveform is the incident voltage step recorded as the wave passes the point on the transmission line monitored by the oscilloscope.

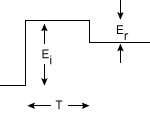
If an impedance mismatch exists at the load (Er ≠0), part of the incident wave is reflected. The reflected voltage wave appears on the display screen added to the incident wave algebraically.
Locating Mismatches
In time domain reflectometry (TDR), the reflected wave is easy to distinguish from the incident wave due to the separation in time. This time separation is valuable in determining the length (D) of the transmission line from the monitoring point to the impedance mismatch.

where Vp is the velocity of propagation and T is the transit time from monitoring point to the mismatch and back again.
The velocity of propagation can be determined from an experiment on a known length of the same type of cable under test. For example, the time required for the incident wave to travel down and the reflected wave to travel back from an open circuit termination at the end of a 120 cm piece of RG-9A/U is 11.4 ns. This results in a Vp of 2.1 x 10 cm/s. Knowing the Vp and reading T from the instrument determines D. The impedance mismatch can then be located on the transmission line.
In FlexDCA, you can measure the distance between two discontinuities by placing two tracking markers on a waveform that is displayed in a Time domain Displays (Time-Ohms, Time-Volts, or Time-% windows). You can also use markers to measure frequency separation in Frequency Domain Displays (Freq-Mag, Phase, and Group Delay windows).
Analyzing Reflections
The shape of the reflected wave is valuable since it reveals both the nature and magnitude of the mismatch. The following table show four typical TDR displays and the load impedance responsible for each. When interpreting this information, recall that:

The characteristic impedance of a transmission line is represented as Zo
Knowledge of Ei and Er, as measured on the instrument, allows ZL to be determined in terms of Zo, or vice versa. Using the table, you can verify that the reflections are actually from the terminations specified. If you assume ZO is real (approximately true for high quality commercial cable), you will notice that resistive mismatches reflect a voltage of the same shape as the driving voltage with the magnitude and polarity of Er determined by the relative values of Zo and RL.
| Termination | Description of Reflection |
|---|---|
Open Circuit |

|
Short Circuit |

|
Double the Characteristic Impedance |

|
Half the Characteristic Impedance |

|
Complex Load Impedances
The following table shows four basic reflections produced by complex load impedances. The characteristic impedance of a transmission line is represented as Zo.
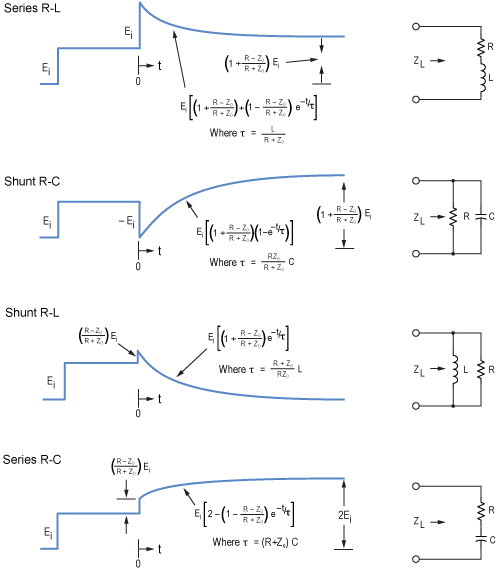
The above waveforms can be verified by writing the expression for ρ (s) in terms of the specific ZL for each example. In other words,

or,

and so on.
To find an expression for er(t), you can multiply ρ (s) by the transform of a step function of Ei and then transform this product back into the time domain. This procedure is useful, but a simpler analysis is possible without resorting to Laplace transforms. The more direct analysis involves evaluating the reflected voltage at time t = 0 and at time t = ∞ and assuming any transition between these two values to be exponential. For simplicity, time is chosen to be zero when the reflected wave arrives back at the monitoring point.
For example, in the case of the series R-L combination at t = 0, the reflected voltage is +Ei. The inductor will not accept a sudden change in current; it initially looks like an infinite impedance, and ρ = +1 at t = 0. Then current in L builds up exponentially and its impedance drops toward zero. At t = ∞ therefore er(t) is determined only by the value of R as shown in the following equation:

when τ = ∞.
The exponential transition of er(t) has a time constant determined by the effective resistance seen by the inductor. Since the output impedance of the transmission line is Zo, the inductor sees Zo in series with R and therefore the time constant of the exponential transition of er (t) is:

A similar analysis is possible for the case of the parallel R-C termination. At time zero, the load appears as a short circuit since the capacitor will not accept a sudden change in voltage. Therefore ρ = –1 when t = 0. After some time, however, voltage builds up on C and its impedance rises. At t = ∞, the capacitor is effectively an open circuit, and er(t) is determined only by the value of R, as shown in the following equation:

when τ = ∞.
The resistance seen by the capacitor is Zo in parallel with R, and therefore the time constant of the exponential transition of er(t) is:

The two remaining cases can be treated in exactly the same way.
Discontinuities on the Line
Previous topics in this section have discussed the effect of a mismatched load at the end of a transmission line. Often, however, you may not only be concerned with what is happening at the load, but also at intermediate points along the line. Consider the transmission system in the following graphic.

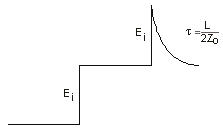
The junction of the two lines (both of characteristic impedance Zo) employs a connector of some sort. Assume that the connector adds a small inductor in series with the line. Analyzing this discontinuity on the line is not much different from analyzing a mismatched termination. In effect, you can treat everything to the right of M in the figure as an equivalent impedance in series with the small inductor. You can then call this series combination the effective load impedance for the system at the point M. Since the input impedance to the right of M is Zo, an equivalent representation is shown in the next graphic.

The displayed waveform will appear as follows.
Multiple Discontinuities
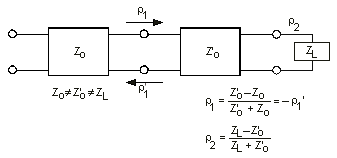
One of the advantages of TDR is its ability to handle cases involving more than one discontinuity. Refer to the following graphic.
The instrument display for this situation would be similar to the following, assuming Zo > Z'o < ZL
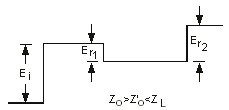
It is evident that the two mismatches produce reflections that can be analyzed separately. The mismatch at the junction of the two transmission lines generates a reflected wave Er1 where:

Similarly, the mismatch at the load also creates a reflection due to its reflection coefficient:

Two things must be considered before the apparent reflection from ZL (as shown on the instrument display) is used to determine ρ2. First, the voltage step incident on ZL is not merely Ei but:

Second, the reflection from the load is

However, this is not equal to Er2 since a re-reflection occurs at the mismatched junction of the two transmission lines. The wave that returns to the monitoring point is:

Since ρ′1 = –ρ1, Er2 may be re-written as

The part of ErL reflected from the junction of ZO and ZO′, in other words, ρ1´ErL is again reflected off the load and heads back to the monitoring point only to be partially reflected at the junction of ZO´ and ZO. This continues indefinitely, but after some time the magnitude of the reflections approaches zero.
If the transmission lines represented by ZO´ and ZO are assumed to have no loss (R or G), the peeling function can be used to remove these re-reflections, making it much simpler to identify the values of ZO, ZO´, and ZL in a TDR waveform.