Step 6. Run Test
After a Response Calibration, FlexPLL performs some background tasks and then starts a jitter measurement sweep.
Save Response Data
Be sure to save your important response waveforms to a response file (*.rspx). Response files not only save your data, but they can also be loaded into one of four Response Memories.
- To save a response, click File > Save to open the Save dialog, and select the Response tab.
- To import a response file into a response memory, click File > Response Memory. In the Response Memories dialog, select a Memory tab, and click Load.
JTF & OJTF Modeling
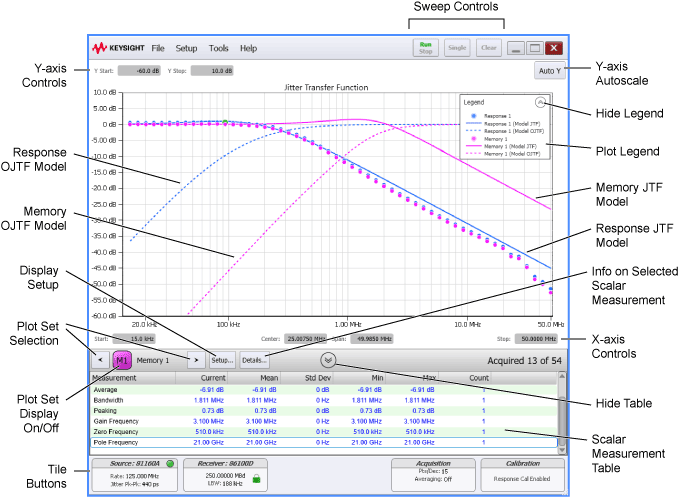
Use the PLL Model Setting dialog to add modeled JTF and OJTF plots and measurements. In this dialog you can use automatically calculated or manually entered loop parameters to model a variety of variations for DUT designs. The displayed graph legend identifies each model that you have enabled. More information is available in Step 7. PLL Model Setup.
Viewing Measurement Results
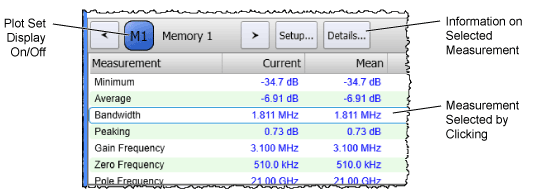
 Click the expand button below the graphs to view or hide the measurement table. FlexPLL performs Bandwidth and Peaking measurements on the Response plots and any Response Memory plots. The following additional measurements can be viewed on Model JTF and Model OJTF plots by enabling them in the PLL Model Settings dialog: Gain Frequency, Zero Frequency, and Pole Frequency.
If you select a measurement, annotation is placed on the waveform to identify the portion of the waveform that relates to the selected measurement.
If you change the Start, Stop, Center, or Span, so that the range is beyond the range of the calibration, data will not be acquired in the uncalibrated regions.