Jitter Spectrum Analysis Graph

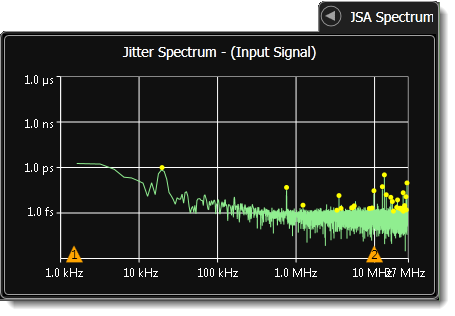
When you click the JSA/CRE toolbar's Display JSA Spectrum button, the JSA Spectrum graph is displayed. With the JSA graph, you can resolve the spectral (frequency domain) distribution of random and deterministic jitter components on clock and data signals. This is the graph of Observed Jitter Transfer Function (OJTF) which is the jitter spectrum of the input signal relative to one of three selectable reference signal as explained in JSA/CRE Concepts. On the graph, the  and
and  symbols show the location of the integration limits, which are defined using the Jitter Spectrum Analysis Setup dialog.
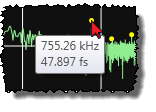
If you hover the pointing device over a spectral peak (identified by a yellow circle), a listing of the peak's frequency and magnitude values briefly appear. The frequency and magnitude values of the peaks that are within the band limiting are also listed on the Jitter Spectrum Analysis Results panel.