Jitter Spectrum Analysis Results

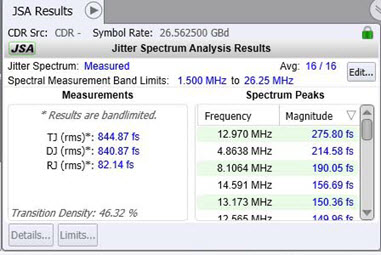
Clicking the JSA/CRE toolbar's JSA On / Off button turns on or of JSA measurements and displays the Jitter Spectrum Analysis Results panel as shown here. This panel displays band-limited jitter measurement results, spectrum peaks, and configuration settings. In the Jitter Spectrum Analysis Setup dialog, the jitter spectrum can be set to the Input, Measured, or Emulated spectrum. This is noted at the top of the panel, where you'll also find the Spectral Measurement Band Limits (integration points), and any applied Averaging. When JSA memory data is viewed, the JSA button is labeled JSA Memory Off.
 Click the edit button to open the Jitter Spectrum Analysis Setup dialog where you can configure the measurement settings, including the PLL emulation setup.
On the left side of the panel, you'll find the jitter Measurements TJ (rms), DJ (rms), and RJ (rms). These jitter results are band-limited using integration limits that are specified in the Jitter Spectrum Analysis Setup dialog. If you click on a measurement to select it, as shown for TJ (rms) in the above figure, the Details and Limits buttons become active. Click Details and then Algorithm to learn about the measurement. Click Limits to configure a limit test on the measurement.
On the panel's right side are the list of the identified Spectrum Peaks, which are within the band limits. Those peaks that are outside of the band limits on the JSA spectrum graph are not listed in the table. For each peak, the frequency and magnitude values are shown. These same peaks are also identified on the JSA Spectrum graph. In the Spectrum Peaks listing, click on the Frequency or Magnitude headings to change the order of the listings. This displays the sort-order buttons:  and
and  .
.