Composite TI Histogram
Instrument:
N1000A-PLK
N109X-PLK
Flex Apps:
FlexDCA
Meas. mode:
Jitter
Waveform type:
PAM4
NRZ
Package License:
L-RND
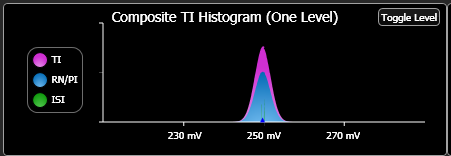
 The Composite Interference Histogram shows TI, RN/PI, and ISI plots superimposed. A small triangle shaped marker on the horizontal axis shows the location of the one and zero levels.
On the graph, repeatedly click the Cycle Level button to cycle through the waveform levels on which the histogram is based. To globally specify the level for all affected graphs:
- Click Measure > Configure Jitter Mode Measurements to open the dialog.
- In the dialog, select the Amplitude Measurements tab.
- In the Show Graphs Based on field, select the desired level. This setting effects to all Amplitude graphs except SER Amplitude Bathtub.