Noise Spectrum
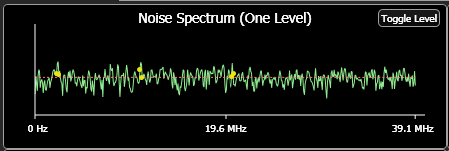
 The aliased noise spectrum graph provides additional insights into the measurements performed in Amplitude Mode. It is a qualitative tool only; the noise spectrum is aliased and the vertical axis is not labeled. The peaks on the graph that have been identified as periodic noise (excluded from random noise calculations) are marked with yellow dots. Because the signal is under-sampled, all periodic components are aliased down below 20 kHz. The RN is calculated as the area of the power spectral density excluding any peaks in the spectrum (for example, the baseline noise of the power spectral density).
On the graph, repeatedly click the Cycle Level button to cycle through the waveform levels on which the histogram is based. To globally specify the level for all affected graphs:
- Click Measure > Configure Jitter Mode Measurements to open the dialog.
- In the dialog, select the Amplitude Measurements tab.
- In the Show Graphs Based on field, select the desired level. This setting effects to all Amplitude graphs except SER Amplitude Bathtub.