ISI vs Symbol
 The graph of Inter-Symbol Interference versus relative symbol position graph shows the average level of each symbol over the symbol pattern.
On the graph, repeatedly click the Cycle Level button to cycle through the waveform levels on which the histogram is based. To globally specify the level for all affected graphs:
- Click Measure > Configure Jitter Mode Measurements to open the dialog.
- In the dialog, select the Amplitude Measurements tab.
- In the Show Graphs Based on field, select the desired level. This setting effects to all Amplitude graphs except SER Amplitude Bathtub.
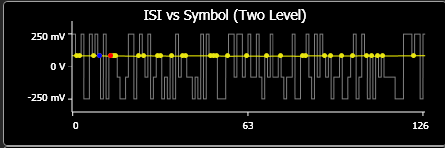
 Use the horizontal scale and position knobs to pan and zoom the displayed relative symbol positions. Or, simply drag the cursor using a mouse or your finger to define a region that you want to expand. The Pattern count (with percentage complete) is listed on the graph as an indication of the measurement progress. Each pattern count indicates that a complete data acquisition record has been acquired. When the first pattern data acquisition is complete, the graph is ready to view. The graph is updated after each subsequent pattern data acquisition has been acquired and summed with the current data.
Starting with firmware version A.05.60, the name of this graph was changed from ISI vs Bit to ISI vs Symbol.