SER Amplitude Bathtub
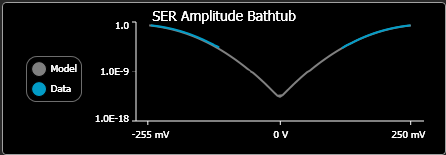
 The SER Amplitude Bathtub graph shows zero level data on the left side and one level data on the right side. The SER Bathtub graph plots TI data and dual-Dirac SER values across the entire amplitude range on the horizontal axis. The dual-Dirac SER values are calculated using DI (δ-δ) and RI and are used to extrapolate to low SER levels. In general, the dual-Dirac values will differ from the measured TI values at high probabilities, but the two should converge at low probabilities. The SER value that is used for calculating TI can be changed from its default value of 1E-12. Use selections in the Configure Jitter Measurements dialog's Advanced tab.
On the graph, repeatedly click the Cycle Level button to cycle through the waveform levels on which the histogram is based. To globally specify the level for all affected graphs:
- Click Measure > Configure Jitter Mode Measurements to open the dialog.
- In the dialog, select the Amplitude Measurements tab.
- In the Show Graphs Based on field, select the desired level. This setting effects to all Amplitude graphs except SER Amplitude Bathtub.