Capacitive Loading
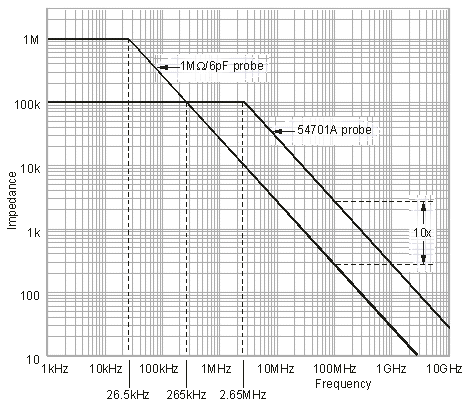
The input capacitance of a probe causes the overall input impedance to decrease as a function of frequency. For this reason, input capacitance becomes one of the most important parameters that affect high frequency measurements. The following graphic plots the probe impedance against frequency for two probes: a 1 M Ω , 6 pF probe and the 54701A probe (100 k Ω , 0.6 pF).

You will notice that due to the lower input capacitance, the 54701A probe actually has higher input impedance for frequencies above 240 kHz. At frequencies above 2.65 MHz, it has as much as 10 times the impedance of the 1 M Ω probe.
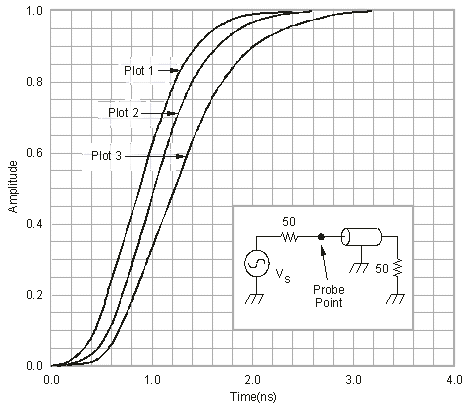
The input capacitance of a probe forms an RC time constant with the parallel combination of source impedance and probe input resistance. This can cause an increase in the circuit rise time and a time delay in a pulse edge. The following graphic represents plots from three SPICE simulations showing this loading effect.
The circuit used in this graphic is modeled after a 50Ω system with a 1 ns source and terminated transmission line with 500-ps delay. The inset graphic shows the SPICE model, with the probe point where the probe was connected. As signals achieve faster rise times, probes with lower input capacitance are required to make accurate timing and rise time measurements.

| Plot Number | Rise Time | Delay |
|---|---|---|
| 1 - shows the signal edge before probing | 1 ns | 0.0 ps |
| 2 - shows the edge after probing with a 6 pF probe | 1.067 ns | 150 ps |
| 3 - shows the edge after probing with a 15 pF probe | 1.33 ns | 340 ps |
You will notice that the 6 pF probe did not significantly increase the rise time of the signal, but delayed it (referenced at the 50% point) approximately 150 ps. The 15 pF probe not only slowed the rise time approximately 33% but also delayed the edge 340 ps.