Jitter Mode Setup (Graphs tab)
Graphs
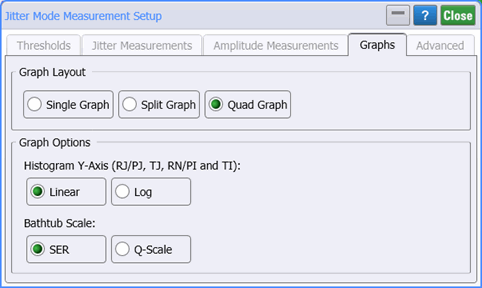
Use the Graphs tab of the Jitter Mode Measurements Setup dialog, to configure graphs.
For 12-Edge Output Jitter measurements, only the Histogram Y-Axis field is available.

Graph Layout
The Graph Layout selection refers to the maximum number of graphs displayed at one time. The choices are one (Single), two (Split), or four (Quad) graphs. Double click a Jitter Mode graph to toggle between the display of single and multiple graph views.
Graph Options
Histogram Y-Axis
For the jitter RJ,PJ, and TJ graphs and the amplitude graphs RN, PI, and TI graphs, the y-axis can be displayed using a linear scale (default) or log scale. This control does not apply to composite histograms.
Figure. Linear Scale

Bathtub Scale
Use to select the y-axis units (BER or Q-Factor) for the BER Bathtub graph.
Figure. Log Scale
