Meas Toolbar
| Button Enabled (PAM waveform) |
Button Disabled (NRZ waveform) |
|---|---|

|

|
The Meas toolbar allows you to add scalar measurements to the default measurements that are already displayed in the panels that are located beneath the graph area:
- For NRZ formatted waveforms, the Jitter and Amplitude panels are displayed, and PAM4 measurement buttons are disabled.
- For PAM4 formatted waveforms, the Eye and Level panels are displayed, and NRZ measurement buttons are disabled.
Toolbar 1 of 3

Jitter On/Off

On/Off

Jitter Table
(NRZ)

Eye Table
(PAM4)


correlated
Jitter
Toolbar 2 of 3

F/2

Ampl Table
(NRZ)

Level Table
(PAM4)


correlated
Noise


To reset panels to their default measurements, click the toolbar's Reset buttons.
On the panels, you can select any measurement and click the panel's:
- Details button to open the measurement's help topic.
- Limits button to configure and start a Measurement Limit Test on the measurement.
-
 button to delete the measurement from the panel. To reset the panel to include all of the default measurements including those that have been removed, click the Meas Toolbar's Reset buttons.
Normally, data acquisition and measurement happens very quickly. As soon as the graphs scroll over the screen, the results are displayed. If, however, you are measuring very long patterns (for example, 216–1 PRBS), you may notice a delay between the time when the graphs scroll down and the final results are displayed in the panels. How can you tell when your measurements are finished? Look for the measurement annotations in the Jitter and Amplitude panels. The text "No Data" next to an entry indicates the edges are being characterized. A question mark (?) next to a measurement result indicates that indicates a measurement in process.
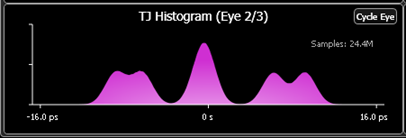
For PAM4 signals, many jitter graphs can be based on a specific eye. To change the eye that is graphed, do one of the following:
- Click the graph's Cycle Eye button.
- Change the Graphs Based on setting in the Jitter Measurements tab of the Configure Jitter Measurements dialog.
Many amplitude graphs show results based on amplitude levels. To change the level that is graphed, do one of the following:
- Click the graph's Cycle Eye button.
- Change the Graphs Based on setting in the Amplitude Measurements tab of the Configure Jitter Measurements dialog.