Lesson 2. Creating a Butterworth User Operator Script
Instrument:
N1000A
N109x
UXR Scope
Flex Apps:
FlexDCA
FlexRT
Meas. mode:
Scope
Eye
Jitter
TDR
Package License:
L-RND
In this MATLAB example, you'll learn how to create a Butterworth filter operator in the FlexDCA / MATLAB environment. After you finish this lesson, continue with Lesson 3 to convert this operator into a MATLAB standalone application.
Procedure
- Complete Lesson 1, if you have not already done so.
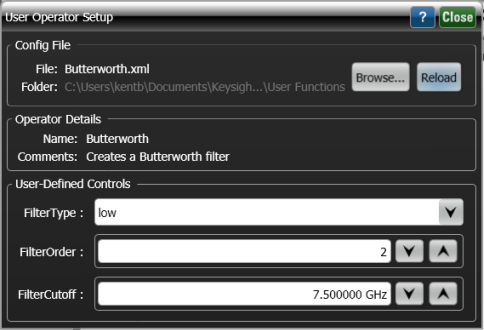
- Copy the following XML listing into a text editor. Name the file Butterworth.xml and save it in FlexDCA's user functions folder (\Documents\Keysight\FlexDCA\User Functions). Notice how the XML <Control> elements will be used to create the User-Defined Controls shown in the following picture of the User Operator Setup dialog.
- <?xml version="1.0" encoding="utf-8"?>
- <Function xmlns:xsd="http://www.w3.org/2001/XMLSchema"
- xmlns:xsi="http://www.w3.org/2001/XMLSchema-instance">
- <Script>Butterworth.m</Script>
- <Name>Butterworth</Name>
- <Abbreviation>Butter</Abbreviation>
- <Comments>Creates a Butterworth filter</Comments>
- <FunctionType>1 Source</FunctionType>
- <Control Name = "FilterType">
- <Enumeration>
- <Default>low</Default>
- <Selection>low</Selection>
- <Selection>high</Selection>
- </Enumeration>
- </Control>
- <Control Name = "FilterOrder">
- <Integer>
- <Min>1</Min>
- <Max>4</Max>
- <Units>None</Units>
- <Default>2</Default>
- </Integer>
- </Control>
- <Control Name = "FilterCutoff">
- <Double>
- <Min>10e6</Min>
- <Max>1000e9</Max>
- <Resolution>1000</Resolution>
- <Units>Hertz</Units>
- <Default>7.5e9</Default>
- </Double>
- </Control>
- </Function>
- Copy the following script into MATLAB's editor. Name your script file Butterworth.m and save it in FlexDCA's user measurements folder (\Documents\Keysight\FlexDCA\User Functions). Color in the following script identifies:
- Output variables that are initialized.
- Input variables that are assigned to local function variables.
- User-defined control variables that are assigned to local function variables.
- Filtered output waveform that is created.
- Place FlexDCA into Oscilloscope or Eye/Mask modes and display a single waveform on the display.
- On FlexDCA's menu, click Measure > Waveform Signal Processing (Math).
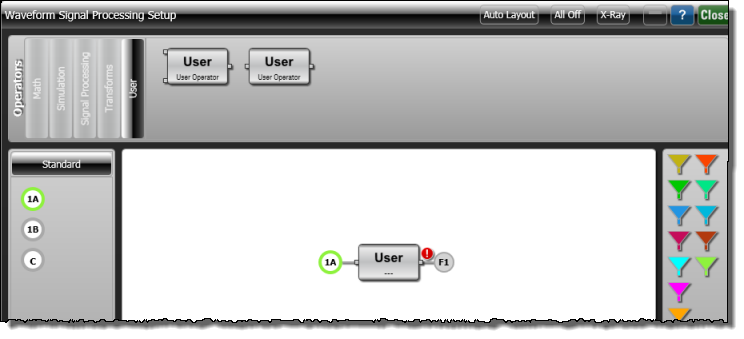
- At the top of the Waveform Signal Processing dialog, select the User tab and drag a single-input User operator icon into the operator construction area as shown in the following picture.
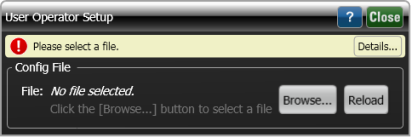
- Click on the user operator to open the User Operator Setup dialog.
- In the dialog, click Browse and select your XML configuration file, Butterworth.xml. The dialog is populated with settings from the XML file.
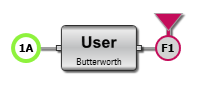
- In the Waveform Signal Processing dialog, drag a Function Color to the User Operator as shown in the following picture. This will display the output waveform of the function.
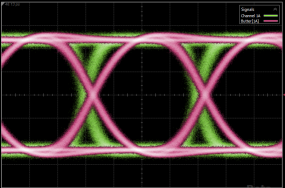
- Click Autoscale and the input and output waveforms should be displayed. Of course, your waveforms will be different from those shown here. The important thing is that both the input and output waveforms are displayed. Notice that the Signals legend identifies the operator's output waveform.
|
|
|
% Initialize output variablesFiltData = []; % Output waveformGain = 1.0; XUnits = 'Same'; YUnits = 'Same'; ErrorMsg = ''; % Gather input data SrcData = SrcData; % Input waveform XOrg = XOrg; XInc = XInc; IsPeriodic = IsPeriodic; % Gather user-defined controls N = FilterOrder; Fc = FilterCutoff; FType = FilterType; % Constant output variables FilterDelay = N * 0.112 / Fc; FilterWidth = N / Fc; if ~isempty(SrcData) % Create the filter Wn = 2 * XInc * Fc; [B,A] = butter(N, Wn, FType); numPts = length(SrcData); if IsPeriodic % Perform the filtering circularly using ffts. fftSrcData = fft(SrcData); h = freqz(B, A, numPts, 'whole').'; FiltData = real(ifft(fftSrcData .* h)); % Rotate to remove FilterDelay. shift = round(FilterDelay / XInc); FiltData = circshift(FiltData, [0, -shift]); else startIndex = ceil(FilterWidth / XInc) + 1; if (startIndex > numPts) ErrorMsg = 'Too few points. Pipeline eats up entire waveform.'; else % Perform the filteringFiltData = filter(B, A, SrcData); % Remove filter delay and pipelineFiltData = FiltData(startIndex:end); leadPipeline = FilterWidth - FilterDelay; XOrg = XOrg + leadPipeline; end end end |
Do not use spaces or hyphens when selecting a filename for your script.
Enter the above script exactly as written. Otherwise, the script will fail.
You may have to wait a few seconds for the waveform to appear and the waring icon (![]() ) to be removed.
) to be removed.