Display Setup (Graticule tab)
Graticule
Use the Display dialog to configure how waveforms, graticule, and dialogs appear.
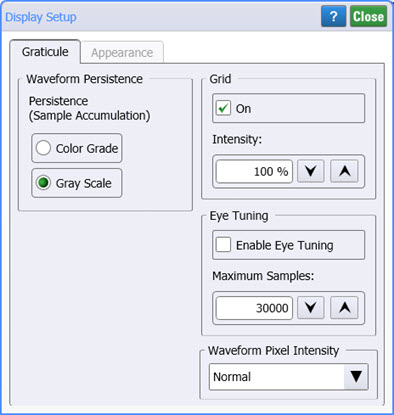
Waveform Persistence
Persistence determines how long a data point is kept on the display before being erased from the display graticule. Persistence is a display memory function, therefore acquired waveforms are written only to display memory. Acquisition memory is where the current waveform data is stored. Therefore, only the last acquired waveform is held in acquisition memory. Display memory is what is seen on the display graticule. The persistence control allows you to view the extremes of a waveform's variation, such as the occurrence of jitter. Setting the persistence to the minimum amount of time allows for easiest viewing of variations in the acquired waveforms. Setting the persistence to the maximum amount of time (infinite) allows for a complete view of everything measured in the waveform. Depending on instrument mode, you can select the type of persistence.
| Persistence | Oscilloscope | Eye/Mask | Jitter |
|---|---|---|---|
| Infinite | ♦ | ||
| Color Grade (Infinite) | ♦ | ♦ | ♦ |
| Gray Scale (Infinite) | ♦ | ♦ | ♦ |
| Minimum | ♦ | ♦ | |
| Variable | ♦ |
Infinite
Infinite displays the sampled data points for an endless period of time. As sample points are acquired, the luminosity of the sample points changes in intensity. Newly acquired sample points are shown at full intensity while previously acquired points are displayed at half intensity. You can use this mode to measure the worst-case characterization of signal noise, jitter, signal drift, timing, and find infrequent events. In infinite persistence mode, all sampled data points are left on the display until one of the following is adjusted or executed: Clear Display, Auto Scale, Default Setup, operating mode changed, mask testing, vertical or horizontal settings, trigger settings, display source state (on or off), or acquisition settings.
Gray Scale (Infinite) and Color Grade (Infinite)
Gray Scale (Infinite) and Color Grade (Infinite) modes use a measurement database to display waveforms. The database contains all data samples displayed on the screen and provides the data for the construction of measurement histograms and performing mask tests.
Each time a specific display sample point is acquired (time and amplitude coordinate), a counter for that coordinate is incremented. The maximum count for each counter is 232. To display the data, coordinate counts are divided into desity ranges. In Gray Scale (Infinite) mode, desity ranges are represented by shades of the same color (one hue with variations in saturation and luminosity). In Color Grade (Infinite) mode, desity ranges are represented by separate colors. Both modes display sampled data points for an endless period of time. The peak density of data counts is represented by the brightest regions of the waveform. If these persistence modes are left on for a long time, the waveform becomes saturated with the color of highest hits.
To change the colors used to present Color Grade or Gray Scale persistence waveforms, click the Appearance tab in this dialog.
Minimum
Minimum sets the display time of each waveform data point to the minimum of 40 ms or one trigger cycle. You can use the minimum persistence mode to view the fastest display update rate. When the waveform acquisition is stopped, the last acquired data points are left on the display.
Variable
Variable allows you to define the Persistence Time of the input waveform. Newly acquired sample points are displayed at full intensity (brightest) while the intensity of previously acquired sample points fade to black during the defined persistence time. You can use this mode to view infrequent events and rapidly changing waveforms. You can set the time a waveform sample point is displayed from 100 ms to 40s, with one digit resolution. The default setting is 300 ms. If one of the following is changed, the displayed waveform is redrawn and any accumulated waveforms are cleared: the vertical or horizontal scaling, the vertical or horizontal position, the offset, the trigger source or level, a clear display is executed, or an Auto Scale is executed.
| Persistence Time in Seconds | Resolution (Step Size) |
|---|---|
| 0.1 - 0.9 | 0.1s steps |
| 1 - 10 | 1s steps |
| 10 - 40 | 10s steps |
Waveform persistence applies only in the display graticule area.
The Eye/Mask mode measurement algorithms are based on the statistical accumulation of the data that the Color Grade and Gray Scale mode use internally.
If you are adjusting the amplitude or frequency of a signal source, you may find that more persistence (variable, infinite, color grade or gray scale) is useful for observing long-term changes in a signal or observing signals with low repetition rates. If you are adjusting signal parameters, such as scale or delay, you will find that minimum persistence is useful due to the fast update rate.
Grid
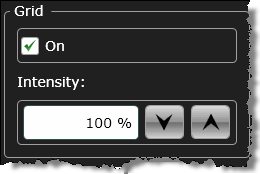
You can change the appearance of the grid lines on the display graticule. Click On to turn the grid on and off. The outer edges of the display graticule will remain visible. The default condition is on. If the grid is turned on, the brightness can be adjusted. You can adjust the intensity between the values of 0 (no brightness) to 100 (full brightness). The default value is 100.
Eye Tuning
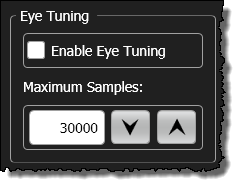
In Eye/Mask mode, the Eye Tuning fields are displayed and are used to obtain a variable persistence display. It is especially valuable when you are tuning a device while simultaneously watching changes to the eye diagram and eye diagram measurements. For example, you can tune a laser's bias point while monitoring an Extinction Ratio measurement. It is important to note that eye tuning may decrease the accuracy of the measurement results. When your adjustments are completed, clear the eye tuning selection to ensure the measurement results return to their highest accuracy.
Enter a Maximum Samples value to specify exactly how many samples you want to keep in the eye diagram. For example, if you specify 50,000 samples and once there are 50,000 samples in the eye, then one sample will drop out of the eye for every new sample placed in the eye.
To view the eye tuning selections, you must first select Color Grade or Gray Scale persistence. Eye tuning requires Color Grade or Gray Scale persistence.
Connect Waveform Points
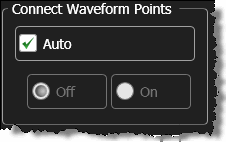 In Oscilloscope mode, the Connect Waveform Points fields are available with Persistence set to Minimum, Infinite, or Variable. When Connect Waveform Points is enabled, lines are displayed to connect the consecutive data points on the display. This allows you to view what the waveform actually looks like. Auto is selected by default to automatically configure the setting for the type of displayed waveform. You can always clear this setting to manually turn this feature on or off. Connect Waveform Points mode is not available in Eye/Mask mode.
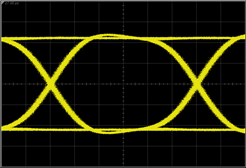
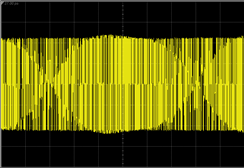
The following figures show an example of when Connect Waveform Points should be turned off (Auto mode). Oscilloscope mode is designed for single-valued waveforms and not eye diagrams. Repetitive, random signals, such as the PRBS signal shown here, result in a displayed eye-diagram. But, as the waveform lacks relative timing information between the displayed points, setting Connect Waveform Points to On results in line that are drawn between unrelated waveform points.
Connect Waveform Points Turned Off
Connect Waveform Points Turned On
Waveform Pixel Intensity
Sometimes, waveforms may be difficult to see in screen captures or when the display is viewed at a distance, such as during a presentation. This can be the result of FlexDCA's high screen resolution or the fact that some waveforms have a relatively small number of measurement points. With waveform pixel intensity, the number of display pixels used to represent a data point or line is expanded for easier viewing. Although thin traces and clusters of data points appear thicker and brighter on the display, the acquired data is not changed and all measurements, markers, histograms, saved waveforms, and other items are not affected.
The following table shows display examples for the four available pixel intensity selections. By default, pixel intensity is not applied. Depending on the type of waveform displayed, one of these selections may make the waveform easier to see.
Starting with FlexDCA revision A.07.40, waveform pixel intensity can be applied to charts and graphs such as S-Parameter, T-Parameter, and FFT operator output.
| Emphasis | Displayed Waveform | Closeup of Waveform |
Closeup of Three Data Points (with Connect Waveform Points turned off) |
|---|---|---|---|
| Normal |
|
|
|
| Medium |
|
|
|
| High |
|
|
|
| Very High |
|
|
|
Enable Multi-Touch
The Enable Multi-Touch setting is displayed in the dialog whenever FlexDCA is installed on a PC or N1000A in which a capacitive touch-screen display is used. Select this setting to enable the mouse control mode buttons (waveform pan and zoom) to respond to touch gestures on the display rather than the dragging of the mouse pointer.

The following picture shows the mouse control mode buttons which are located on the right side of the content window toolbar.

| Drop Down Buttons |
Button | Description |
|---|---|---|
|
|
|
Drag the mouse or use touch gestures over a waveform to zoom in on a selected area. |
|
|
Reverses a previous waveform zoom. Multiple clicks undos a series of previous zoom actions. | |
|
|
Use the mouse or touch gestures to move the waveform in both the vertical and horizontal directions. | |
|
|
Use the mouse or touch gestures to move the waveform in only the horizontal directions. |