Panels
Panels
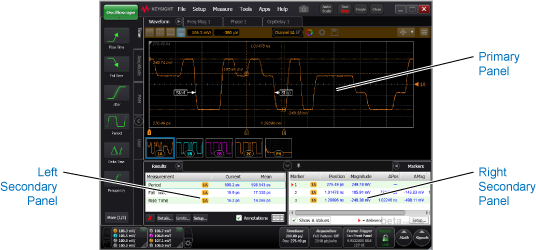
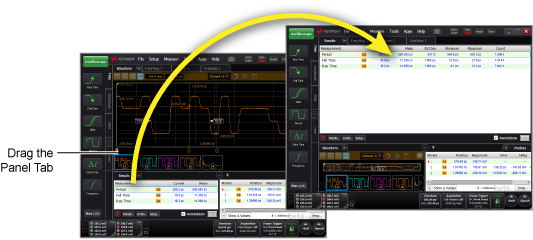
As shown in the following picture, there is one primary and two secondary panels. FlexDCA uses these panels to show waveforms and scalar measurement results. By default, waveforms are shown in the primary panel. You can move the content between any two of these panels by draging a panel's tab over a different panel. In fact, you can drag both secondary panels to the primary window to view all content in the primary window.
Measurement Results
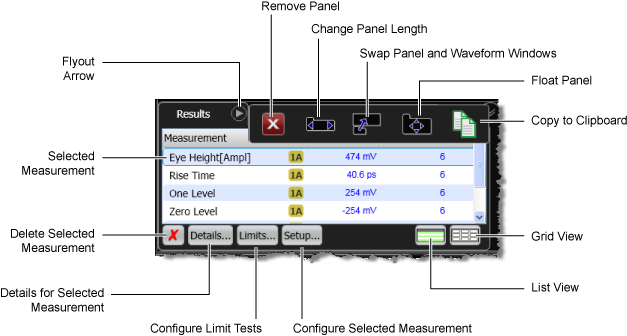
By default, scaler and statistical information is displayed in the secondary panels. The panels only appear when needed. For example, if in Oscilloscope mode you performed a rise time measurement and turned on the markers, the Results and Markers panels appear. The following picture shows an example measurement Results panel in Eye/Mask mode.
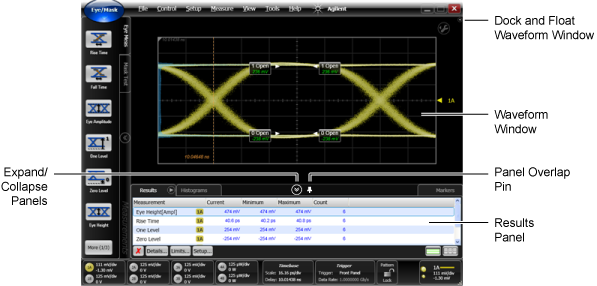
![]() Click the expander arrow to collapse (hide) or expand (display) the panels.
Click the expander arrow to collapse (hide) or expand (display) the panels.
Panel Overlap Pin
Click the panel overlap pin to overlap  the panels on top of the waveform window or separate
  the panels. You can also control panel overlap using the Overlay Display Tabs setting in the Display Setup dialog's Appearance tab.
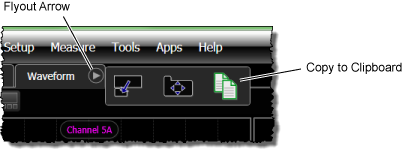
Waveform Window's Flyout Arrow
As shown in the this picture, you can click the waveform window's flyout arrow to float or dock the main waveform window.
Click the copy-to-clipboard button to place an image of the displayed waveform onto the clipboard. You can then paste the image into another application.
Panel Buttons and Flyout Arrow
When multiple panels are displayed, click a panel's tab to select the panel. Click the selected panel's flyout arrow ( ) to open the panel-position buttons identified in the following picture. With these tools, you can remove the table, make it full or half width, float it, or swap it with the display's waveform window. Results, Jitter and Amplitude panels include the buttons that are shown in the following picture.
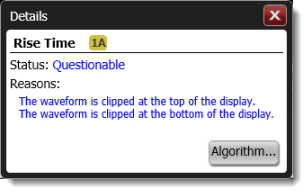
After selecting a measurement result that is listed in the table, click the Details button to view the Details panel shown in the following figure. This panel shows the status of the measurement, which can be "Correct", "Questionable", or "Invalid". The panel lists short explanations if the measurement is "Questionable" or "Invalid". Click the Algorithm button to display a help topic that describes how the measurement is made.