:HISTogram Subsystem
Use the Histogram subsystem commands to configure up to four available histograms. The four histograms are identified by the {1:4} in the HISTogram{1:4} command. These command provide control for the equivalent features in the Histograms dialog. To return measurements from the Histogram results table, use the :MEASure:HISTogram series of commands.
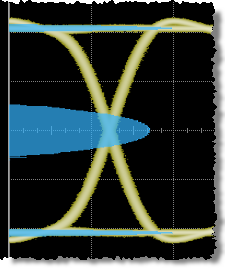
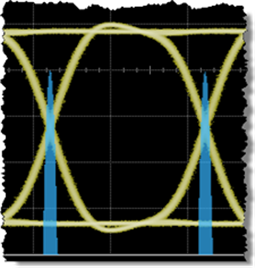
Histograms are a probability distribution of the acquired data within a user-definable histogram window. You can display the histogram either vertically, for voltage measurements, or horizontally, for timing measurements. The most common use for histograms is measuring and characterizing noise or jitter on displayed waveforms. Noise is measured by sizing the histogram window to a narrow portion of time and observing a vertical histogram that measures the noise on a waveform. Jitter is measured by sizing the histogram window to a narrow portion of voltage and observing a horizontal histogram that measures the jitter on an edge.
The :HISTogram:SOURce command selects the waveform on with to construct the histogram. Most of the other commands either define or display the histogram. For example, the :HISTogram:AXIS command sets the histogram's alignment: left, right, top, or bottom. To return the histogram database, use the :HISTogram:ASCii:DATA? query to return an ASCII list of comma separated values. Or, use the :HISTogram:INTeger:DATA? query to return a binary block of 32 bit integers. The data values for both of these queries are the hit counts for each histogram bucket. To return the center of the first historam buket, use the :HISTogram:ORIGin? query. To return the width of each histogram bucket, use the :HISTogram:INCRement? query.
Left-Aligned Vertical Histogram
Bottom-Aligned Horizontal Histogram
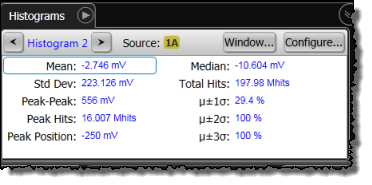
When more than one histogram is displayed, use the :DISPlay:THIStogram command to select the histogram which will have its results displayed in the Histograms measurement results table. In the following figure, histogram 2 has been selected.