About Hit Ratio Mask Testing
An eye diagram is displayed with infinite persistence so that data samples are continuously acquired and added to the database. As more waveform samples are collected, the likelihood of observing outlier samples is increased as is the likelihood of mask failures. In the following figure the sample population is small and failures have not yet occurred.
Small Sample Population without Failures
However in the following figure, a larger population size has resulted in mask violations. This results in repeatability issues and inconsistent in test results. Clearly, this approach to gauge the quality of a transmitter by simple pass/fail criterion is inadequate.
Large Sample Population with Failures
Testing to a mask margin, even when setting the mask margin to the largest dimension possible without mask violations, is subject to the same repeatability problems that are due to sample size.
Mask Margins with Failures
Recent communications standards alleviate the repeatability problem by allowing a specific and very small percentage of the waveform samples to result in mask margin violations. For example, many optical communications standards allow 1 in every 20000 samples (5 X 10⁻⁵) to violate the mask. Test results are consistent from test to test, as the observation of an extreme outlier does not dominate the results. Because testing can represent a significant element in the overall cost of producing high volume optical transceivers, reducing sample size directly reduces test times and cost of test. The use of mask margins coupled with the allowance of a finite percentage of failed samples presents an opportunity to reduce sample size and yet still be confident in the test results.
The following steps are a direct method for testing to a hit ratio (finding the largest margin such that there is at most 1 hit in every 20000 samples):
- Take a sufficient amount of data.
- Apply the eye mask to the acquired eye-diagram data.
- Expand the mask dimensions until any further expansion would result in a violation of the hit ratio limit. For example, if 500000 samples have been collected, the mask dimensions are expanded until more than 25 samples violate the mask.
- The mask dimensions are then reduced to the largest value that results in fewer than 25 violations.
Determining how much data is sufficient is a challenging task. Could the mask margin be accurately determined with a much smaller population than 500000 samples? Ideally, a minimum amount of data should be acquired to achieve the shortest test time. But, if too little data are used, the measurement will be inaccurate, giving misleading results. Existing solutions rely on the user estimating in advance how many samples should be acquired. An alternative approach is to apply the mask when the sample population is small and continuously monitor the results as new data are added to the eye-diagram. A key element of this approach is to provide an accuracy metric that allows an appropriate stop condition to be determined. Data no longer need to be collected once the desired accuracy has been achieved.
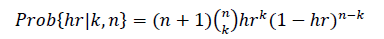
For mask testing to a hit ratio, there are two measurements to consider: the mask margin percentage that results in a specific hit ratio and the hit ratio at a specific mask margin percentage. To simplify the analysis, each sample used in the mask test is assumed to be a Bernoulli trial with the failure probability equal to the hit ratio. Using that assumption, the number of mask hits follows a binomial distribution. Using Bayes' Law it is straight forward to derive a probability distribution for the hit ratio conditional on the number of mask hits and the total number of samples tested.
ITU G.957, �Optical interfaces for equipments and systems relating to the synchronous digital hierarchy� International TelecommunicationsUnion Series G: Transmission Systems and Media, Digital Systems and Networks (2006), pp. 10, 11.
Where hr is the hit ratio, k is the total number of mask/margin hits, and n is the total number of samples used in the mask test. The error term for the hit ratio measurement can be derived as:
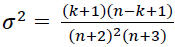
Unfortunately, this only provides information about the uncertainty of the hit ratio measured at a particular margin. This uncertainty information about the measured hit ratio needs to be transformed into an uncertainty about the mask margin that achieves this measurement.
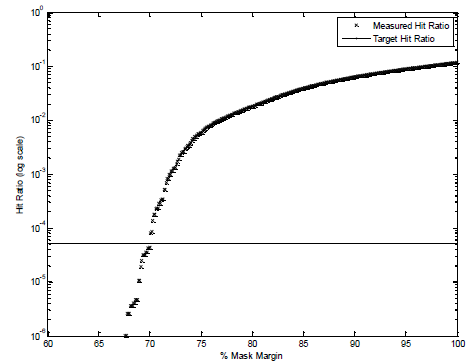
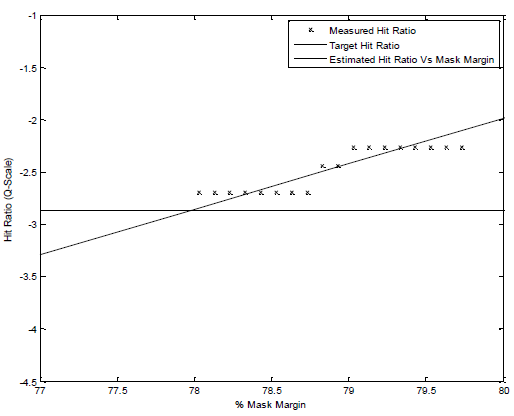
The dependence of hit ratio on mask margin can be mapped by sweeping the margin percentage from −100% to +100%. Using this mapping, a fit function can be found and used to convert from hit ratio to percent mask margin. The function can be assumed to follow a Gaussian distribution in the vicinity of the target hit ratio, since for reasonable target hit ratios the function will be dominated by the random noise and jitter components of the signal under test. By converting the hit ratios to a Q-scale, the fit function will be a straight line. A simple linear least squares regression can be used to determine the function that maps hit ratio to percent mask margin.
Log Scale of Hit Ratio vs. Mask Margin
Q Scale of Hit Ratio vs. Mask Margin
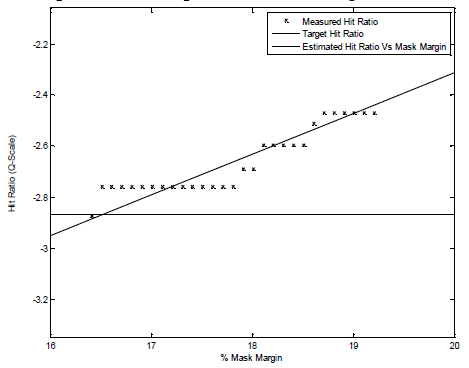
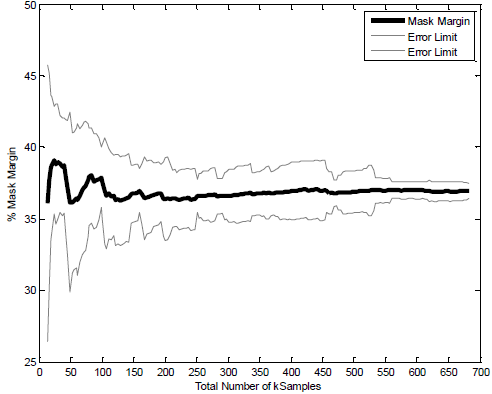
Not only does this mapping function provide a means to get the mask margin uncertainty, but it can also be used to extrapolate the mask margin for a desired hit ratio with a very small number of points. To determine a hit ratio of less than 1 in 20000 with high confidence, it would be expected to take more than 100,000 samples. Using the described method, a reasonable result can be found with approximately 50,000 samples. The actual mask margin will deviate from the confidence interval discribed in the following figure with a probability of less than 1 x 10⁻⁶.
Mask Margin Measurement vs. Number of Samples
Extrapolating to Mask Margin
Similar to Symbol-Error-Ratio (BER) measurements, where the confidence in the BER value is increased as more UIs are observed, the uncertainty in mask margin values is reduced as more waveform samples are added to the eye diagram database. However, the error magnitude limits around the true value rapidly diminish and there is little value in acquiring a large sample population. A manufacturing engineer can benefit from this by taking only enough data to be confident that a transmitter is able to achieve a desired mask margin. Knowing both the mask margin percentage and the measurement error provides an opportunity to significantly reduce test times, which in turn can increase test system throughput and reduce the effective cost of test.