Noise Figure Application (Opt 028, Opt 029, and Opt 027)
The Noise Figure Application makes fast, easy, and accurate noise figure
measurements.
The information presented in this topic pertains to Noise Figure measurements
on BOTH Amplifiers and Converters unless stated otherwise.
See Also
Noise Figure Calibration
Noise Figure on Converters
(NFX)
Programming commands
PNA-X
Noise Figure Options (PNA Configuration Guide)
High-Accuracy
Noise Figure Measurements Using the PNA-X
Noise Figure and TRL Cal
See other PNA Applications
Noise Figure Options
Explained (029, 028, H29 - obsolete)
See Also: PNA-X
Noise Figure Options (PNA Configuration Guide) - Internet connection
required
029 - (PNA-X
ONLY) Includes low-noise receivers and noise tuner bypass switch to
enable noise figure measurements to 50 GHz. Also includes Opt 028
capability.
028 - Uses
standard PNA receivers to measure noise figure. A noise source
is NOT used during calibration. Any two ports can be used. Use with
DUTs that have sufficiently high gain and noise figure. Additional
filtering may be necessary. Learn
more.
027
- (PNA-X ONLY) Allows PNA-X models with Opt 029 to use mechanical
noise tuners. Learn more.
H29 (obsolete)
- Noise Figure on N5244A (43.5 GHz PNA-X model) and N5245A (50 GHz
PNA-X model). Includes both:
Note:
Option H29 does not include an internal noise tuner.
50 GHz Noise Figure Receivers
Beginning in October 2012, Option 029 (low-noise receivers) is available
in the N5244A (43 GHz), N5245A (50 GHz), and N5247A (67 GHz) models.
- The low-noise receiver and
the noise receiver path switch is added between the port 2 CPLR THRU
jumper connector and the port 2 bias tee. See Option 029 block diagram
below. When it is configured with a multiport test set (i.e. U3024AH10),
the low-noise receiver cannot be used with test ports on the test
set with standard multiport test set jumper connections. See modified
test set connections to use 50 GHz low-noise receiver with multiport
test set.
These models (with option 029) include a built-in
(internal) Noise Tuner which can be selected at the beginning of the
Noise Figure Calibration.
The Noise Tuner switch is managed differently than in 26.5 GHz models.
Learn more.
When used with the N5247A, Noise Figure measurements
between 50 GHz and 67 GHz are possible using the standard receivers
(Opt 028) and a 67 GHz Power Sensor. See
Opt 028 Measurement tips.
See limitations
of the 50 GHz Noise Source.
See Using Opt. 029 (low-noise receiver) with External
Test Set
Noise Figure Application Features
Cold noise method includes correction for imperfect
system source match for highly accurate noise figure measurements.
With Opt 029 you can measure devices with noise figure
values ranging from about 0 to 50 dB and devices with GAIN ranging
from about -40 to +60 dB. Learn more.
With Opt 028 you can also measure noise figure using
standard PNA receivers to 67 GHz. Learn
more.
Measure noise figure of frequency translating devices.
Learn more.
During calibration, ENR values are interpolated for
frequencies between the supplied data points.
Noise Figure Application
Requirements
Noise Tuner - Required for vector noise figure measurements.
Not required for scalar noise figure.
ONLY the N4690 Series ECal modules are supported.
The N4691B m-f is recommended.
Opt 029 provides an additional cable and adapter
to connect the ECal module to the front-panel connectors. Learn
more.
A built-in Noise Tuner is provided with the 50
GHz noise receiver models. Learn
more.
Power Meter - Required when calibrating NFX
(Noise Figure on Converters).
Recommended: An accurate thermometer. Learn
more.
Noise
Source
A Noise Source is NOT required to calibrate the Opt 029 Noise
Receivers. Instead, the Noise Receivers can be calibrated using
a calibrated PNA source. Learn
more.
When using a Noise Source, the following requirements apply:
The 346C Noise Source (recommended) produces
ENR values to 26.5 GHz. The 346B Noise Source can be used up to 18
GHz. The 346A Noise Source can also be used up
to 18 GHz, but requires more averaging
for calibration. The 346C K01 (50 GHz) Noise Source typically
has about 6 dB of ENR at 50 GHz which may NOT yield an adequate
calibration, depending on how many noise averages are used.
An alternative approach calibrates the noise receivers using
a power sensor-based method. Select Use
Power Meter for the noise figure calibration. Learn
more. An adapter may be necessary to connect the
Noise Source to the PNA port 2 reference plane during calibration.
Cal Kit (or second ECal module) with same connector type and
gender as DUT connectors. |
Limitations with the Noise Figure Application
The following features are NOT supported in a noise figure channel:
Noise Concepts
The following conceptual information is a short summary taken from the
Keysight
Noise Figure App Note 57-1.
All electronic circuits have some degree of random noise. The most common
form is thermal noise, which increases as the temperature of the circuit
increases.
The signal-to-noise (S/N) ratio of components in a communications system
is a very important parameter. To improve the S/N ratio, it is usually
easier and more cost-effective to reduce noise than to increase signal
power. In order to reduce noise, an accurate method to measure noise
is required.
Noise Figure
Noise Figure is the degradation in the signal-to-noise ratio as a signal
passes through a device. For example, in the following images:
|
(a)
At the INPUT of the DUT:
The noise floor is -100 dBm, the signal is at -60 dBm,
40 dB above the
noise floor. |
(b) At the OUTPUT of the same
DUT:
The gain has boosted the signal AND the noise floor by 20 dB.
The DUT then added 10 dB of its own noise.
The output signal is now only 30
dB above the noise floor.
Since the degradation in signal-to-noise ratio is 10 dB, the
DUT has a 10 dB noise figure. |
For consistency, noise measurements are calculated as if using a 1 Hz
bandwidth, although measurements are almost always made at higher bandwidths.
The following formula shows the lowest possible noise power in dBm at
290°° K (room temperature).
The only way to measure noise lower than this is to make the measurement
at a lower temperature.
How the Noise Figure Application Works
The goal of the noise figure application is to accurately measure the
noise that is generated by the DUT. This may be done using special
low-noise receivers or using the standard PNA receivers depending on whether
the PNA has Options 029 or 028. Learn more.
The standard receivers are always calibrated using a power meter and
a measurement of the receivers effective noise bandwidth. The low-noise
receivers can be calibrated using either a characterized noise source
or using the same process as a standard PNA source. Learn
more about the noise calibration process.
Some noise measurement error is caused by a poor source match presented
to the DUT input. Therefore, during every measurement, the noise figure
application uses an ECal module to present at least four different impedances
at the input of the DUT. This "Noise Tuner" is connected
to the PNA port 1 front-panel loops that are in the PNA internal source
path (see block diagram below).
From the measurements at various impedance states, the PNA calculates
the noise out of the DUT as though the PNA were exactly 50 ohms. No assumptions
are made regarding the input impedance of the DUT.
Here is how a vector noise figure measurement is made using Option 029.
The sweep numbers are annotated on the PNA display as they occur.
With the noise tuner in the THRU state, S-parameter
measurements are made to accurately characterize the gain of the DUT.
This requires sweeps in both forward and reverse directions.
(sweep #1 and #2).
The noise measurements are performed next. PNA
source power is turned OFF and the noise tuner is switched to the
first impedance state.
At each frequency, the noise receiver samples a large
number of readings in order to attain one
valid measurement. If Noise
Averaging is selected, the specified number of measurements are
made and averaged together to obtain one noise measurement. This continues
for all frequencies (sweep #3).
The next noise tuner impedance state is switched IN
and the noise measurements in step 3 are repeated. This occurs until
measurements are made at all impedance states. At least four impedance
states must be used. (sweeps #4, #5, #6+)
Calibration error terms are applied and calculations
made to simulate the measurement with a perfect 50 ohm input impedance.
The sweep result is plotted on the PNA display.
The PNA begins sweeping again with step 1.
Scalar Noise Figure Measurements
Scalar noise figure measurements can be made beginning with PNA Rev.
A.08.50.
As described above, the noise tuner is switched to at least four different
impedance states before a sweep is plotted. These sweeps are NOT made
in a scalar noise figure measurement, resulting in much faster measurements.
Of course, a scalar noise figure measurement is NOT as accurate as a vector
noise figure measurement because scalar noise figure measurements assumes
that all impedances are 50 ohms. Measurement accuracy can be improved
by adding an attenuator as close to the DUT input as possible. This improves
the effective system source match. The effect of the attenuator loss is
removed during the calibration process.
With scalar noise figure, it is not necessary to connect the noise tuner.
If a noise tuner remains connected, it is switched to the THRU state for
scalar noise figure measurements. This results is a small amount of loss
which slightly degrades measurement accuracy. To increase measurement
accuracy, manually switch the noise tuner switch to the INTERNAL position.
Learn how.
Select Scalar Noise at the first
page of a Noise Figure calibration.
PNA-X Option
H29 - Block Diagram with Noise Figure Components
50 GHz Noise Figure Components are
shaded yellow
At test port
1 front-panel loops, a noise
tuner bypass switch connects the noise tuner (ECal
module) in series with Source1 providing several different
input impedances. At test port
2, a switch and coupler to route RF from
the DUT output to two noise
receivers. The appropriate receiver is automatically
switched as required for the frequency being measured. |
PNA-X Option 029 - Block Diagram
with Noise Figure Components
26.5 GHz Noise Figure Components
are shaded yellow
At test port
1 front-panel loops, a noise
tuner bypass switch connects the noise tuner (ECal
module) in series with Source1 providing several different
input impedances. Learn
more about managing the Noise Tuner switch. At test port
2, a switch and coupler to route RF from
the DUT output to two noise
receivers. The appropriate receiver is automatically
switched as required for the frequency being measured.

50 GHz Noise Figure Components are
shaded yellow
See
Also: 50 GHz
Noise Figure - Built-in Tuner switch below.
|
Noise Figure Option 027
Option 027 allows a PNA-X with
a low-noise receiver to use specialized mechanical tuners on the input
port. These tuners are designed to have a large number of impedance states
that are broadly distributed on a Smith chart. There are two situations
in which a mechanical tuner is advantageous:
When
measuring noise figure at low frequencies. While Ecals are good general-purpose
tuners, they tend to have a suboptimal spread of impedance states
at low frequencies.
When
measuring NF of a device that is poorly matched. Ecal modules are
well suited to measure the noise figure of devices with a match near
50 ohms, but do not perform as well with devices that have match far
from 50 ohms.
Mechanical tuners also improve the
quality of the Noise Parameter measurements NFmin, GammaOpt, and Rho.
The following tuners are supported
by Option 027. All are manufactured
by Maury Microwave.
Model |
Description |
MT981AL14 |
LXI
TUNER, 0.227-4.0 GHZ, 7MM |
MT981BL10 |
LXI
TUNER, 0.4-4.0 GHZ, 7MM |
MT981BL15 |
LXI TUNER, 0.4-2.5 GHZ, 7MM |
MT981BL18 |
LXI
TUNER, 0.4-8.0 GHZ, 7MM |
MT981EL10 |
LXI
TUNER, 0.8-8.0 GHZ, 7MM |
MT981HL13 |
LXI
HGT, 0.8-8.0 GHz, 7MM |
MT981HL14 |
LXI
HGT, 1.8-8.0 GHz, 7MM |
MT981HL15 |
LXI
HGT, 0.65-6.0 GHz, 7MM |
MT981VL10 |
LXI
TUNER, 0.65-6.0 GHZ, 7MM |
MT981WL40 |
LXI
TUNER, 0.6-6.0 GHZ, 7MM |
MT982AL02 |
LXI
TUNER, 1.8-18.0 GHZ, 7MM |
MT982BL01 |
LXI
TUNER, 0.8-18.0GHZ, 7MM |
MT982EL30 |
LXI
TUNER, 0.8-8.0 GHZ, 7MM |
MT982GL01 |
LXI
TUNER, 0.65-18 GHZ, 7MM |
MT982GL30 |
LXI
TUNER, 0.65-8.0 GHZ, 7MM |
MT983BL01 |
LXI
TUNER, 2.0-26.5 GHZ, 3.5MM |
MT984AL01 |
LXI
TUNER , 8-50 GHz, 2.4MM |
XT981AL14 |
LXI
TUNER, 0.227-4.0 GHZ, 7MM |
XT981BL10 |
LXI
TUNER, 0.4-4.0 GHZ, 7MM |
XT981BL18 |
LXI
TUNER, 0.4-8.0 GHZ, 7MM |
XT981HL13 |
LXI
HGT, 0.8-8.0 GHz, 7MM |
XT981HL14 |
LXI
HGT, 1.8-8.0 GHz, 7MM |
XT981HL15 |
LXI
HGT, 0.65-6.0 GHz, 7MM |
XT981VL10 |
LXI
TUNER, 0.6-6.5 GHZ, 7MM |
XT982AL02 |
LXI
TUNER, 1.8-18.0 GHZ, 7MM |
XT982GL01 |
LXI
TUNER, 0.6-18 GHZ, 7MM |
XT982GL30 |
LXI
TUNER, 0.6-8.0 GHZ, 7MM |
XT983BL01 |
LXI
TUNER, 2.0-26.5 GHZ, 3.5MM |
To use a tuner supported by Option
027,
follow this procedure:
Download
driver files for the tuner at the Web address shown below:
https://www.maurymw.com/Support/downloads.php
Run
the driver installation program.
Power
up the tuner and connect it to the PNA via a USB cable.
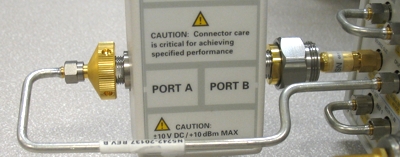
The
tuner should now be available for use. To verify this, start the PNA
application and create a Noise Figure or Noise Figure Converters channel.
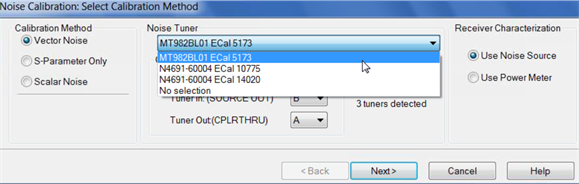
Start the Calibration Wizard, and expand the selections for the Noise
Tuner combo box. The attached tuner should appear in the displayed
list. In the example below, a Maury Microwave MT982BL01 tuner was
used.
Once
the tuner has been recognized, it should be inserted into the signal
path between port 1 and the DUT input. To increase measurement accuracy,
it is best to have the tuner as close to the port 2 calibration plane
as possible. This ensures that the spread of tuner impedances is as
large as possible.
Calibrating with a Mechanical Tuner
No special steps are required to use a mechanical tuner for noise figure
calibration. After verifying that the tuner is recognized by the PNA,
simply perform a noise figure calibration in the usual way. The PNA firmware
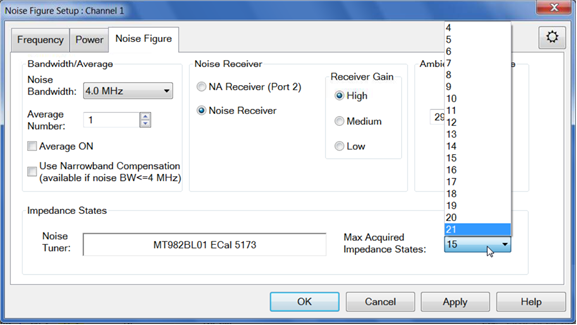
will measure all impedance states of the tuner during calibration. When
the calibration is complete, the number of states used in vector NF correction
can be set in the Noise Figure Setup dialog. In the example below, 15
states have been chosen, but up to 21 states are available.
Caveats when using a Mechanical Tuner
Mechanical
tuners offer distinct advantages, but there are caveats to keep in mind:
Mechanical
tuners are slow. They take more time to move from one impedance state
to another than Ecal modules do. This increases the amount of time
required for corrected NF measurements.
Because
of the increased measurement time, interference can be more of an
issue. Any external signals that can interfere with a noise figure
measurement, such as cell phone traffic, have more opportunity to
intrude. This is important to keep in mind if you are making lengthy
measurements in an unshielded environment.
The
number of sweeps taken during a vector corrected measurement is usually
equal to the number of impedance states, plus two (for the forward
and reverse S-parameter measurements). If a mechanical tuner is used,
the number of sweeps may be about twice as large. This is because
(depending upon frequency range) the tuner may need to take two sweeps
per impedance state, one for low band, the other for high band.
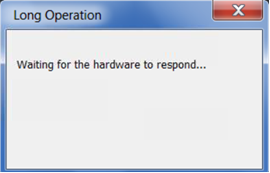
If
a Noise sweep is aborted for any reason, such as a change in stimulus
conditions, the dialog below may appear. This is because the PNA is
waiting for the tuner to complete an operation. The dialog should
disappear after the pending operation is complete.
The Noise Tuner
Switch while making S-parameter measurements
Because of the built-in Noise Tuner in the Option 029 50 GHz noise figure
models, the Noise Tuner switch is managed differently than the 26.5 GHz
noise figure models.
26.5 GHz Models
The default setting for the port 1 noise tuner switch is "External"
as shown in the above diagram. This setting provides incident power through
the front panel loops and the Noise Tuner when connected. When connected,
the Noise Tuner may NOT be in the THRU state, which is necessary for accurate
S-parameter measurements.
The switch is changed in any of the following ways:
Set the switch to INTERNAL for the S-parameter channel
using the path configuration
dialog.
Set the switch to INTERNAL for the S-parameter channel
using the following commands:
Set the switch default to INTERNAL using a preference
setting.
Set the Noise Tuner (ECal module) to the THRU state
using SCPI: CONT:ECAL:MOD:PATH:STATE.
Important Note:
On the 26.5 GHz Opt 029 models, once you set this switch to "Internal",
you must set it back to "External" to make noise figure measurements.
The switch is NOT automatically set to "Internal" during a noise
figure measurement.
50 GHz Models
The switch for the built-in tuner (Opt. 029) is set to "Internal"
(Tuner) ONLY when making vector noise figure measurements. Otherwise,
it is set to "Bypass" (the tuner). Therefore, you should NOT
need to make switch settings. However, the switch can be changed in any
of the following ways:
Using
the Noise Figure Application
Use the following general procedure to make noise figure measurements:
Connect Tuner
and Noise Source.
Create a Noise Figure
Measurement.
Make Noise
Figure Settings.
For Opt 029 and H29, copy your Noise Source ENR file
to the PNA "C:/Program Files/Keysight/Network Analyzer/Noise
folder"
Perform Calibration
Connect the DUT. Learn
more about DUT input and output ports.
Measure Noise Figure.
Optional Click
File, then Save
to save noise figure data. Learn
more.
Connect Noise Tuner and Noise
Source
Connect the noise
source to the 28V connector
on the PNA rear panel. NOT required
for Opt 028. The Noise Source is turned ON and OFF automatically
as needed during a calibration. Connect the noise source to Port 2
reference plane when prompted during calibration.
Connect the noise
tuner (ECal module). See
Noise Tuner requirements.
On the PNA front panel, remove the Port
1 jumper cable SOURCE OUT / CPLR THRU. Opt 028 allows noise
figure measurements using any two PNA ports.
Connect the noise tuner to the front-panel jumpers
for the source (DUT input) port.
See the PNA Configuration
Guide for recommended ECal modules, cables, and adapters.
Create a Noise Figure Measurement
On the PNA front panel, press Meas,
then [Measurement Class]
Select
Noise Figure Cold Source,
then either:
A
noise figure measurement is displayed. The following shows how to
select or change displayed parameters.
Noise Parameters
Several noise parameters, as well as standard parameters, can be measured
in the same Noise channel.
How to add
Noise Parameters
Create a Noise Figure channel. Then do the following: |
Using front-panel
hardkey [softkey] buttons |
Using a mouse
with PNA Menus |
Press Traces then [New
Trace] then select a parameter |
Click Trace/Chan then New
Trace then select a parameter |
How to CHANGE
Noise Parameters
Create a Noise Figure channel. Select the parameter to change. Then do the following: |
Press Meas then select a parameter |
Click Response then select a parameter |

|
Noise Measurements that
are offered
The following three categories of noise measurements can be made with
the PNA:
Noise Figure
is the amount of noise that the DUT is adding in a 50 ohm test setup.
This is explained in detail in Noise
Concepts.
Noise
Power Parameters show the amount of noise coming out of the DUT
in a 50 ohm test setup. With gain measurements of the DUT, these noise
power parameters are used to calculate noise figure.
Noise Parameters
are models of the noise that is generated in a DUT, similar to how
S-parameters model how RF flows through a DUT.
ENR (in dB) = 10 log10((Thot Tcold) / T0),
where T0 = 290K.
Learn more about the ENR table and Noise
Source. Learn more about Noise Source
ENR measurements.
290°°
K = -174 dBm/Hz.
Te
is the unknown variable |

|
Available
Gain Ga
is a function of S11,
S22, and Γs |
Noise Power Parameters
The Noise Power parameters below are offered in the following two formats:
Available
Noise Power The calculated
power that is based on an ideal impedance match at the output of the
DUT. These parameters have always been offered in the PNA noise figure
App.
Incident Noise Power - An 'I'
is appended to the end of the Available Noise Power parameter. The
calculated power into a perfect 50 ohm noise receiver, regardless
of the output impedance of the DUT.
SYSNPD / SYSNPDI - System Noise Power Density:
Total noise power available at the ADC, including the noise
contributed by both the DUT and the internal noise receiver. This
is generally expressed as an absolute power measurement in dBm, but
can also be expressed in Watts or Kelvin.
dBm = 10 log10(k
* T * B * 1000) |
where: |
|
|
k
= Boltzmann's constant |
|
T
= the measured noise temperature |
|
B
= bandwidth |
|
1000
= conversion from milliwatts |
dB = 10 log10(T/290)
DUTNPD / DUTNPDI - DUT Noise Power Density:
When correction is ON, this trace exhibits the available noise
power, best described as the maximum power available from the DUT
where the impedance of the noise port is equal to the output match
of the DUT. To be more precise, this occurs when the noise port match
is equal to the conjugate of the output match of the DUT. The
noise power contributed by the receiver is removed.
When correction is OFF, the trace exhibits
what is more accurately described as delivered power. Delivered
power is the power actually seen by the ADC. Any mismatch between
the receiver and the DUT is ignored. The noise power contributed
by the receiver is removed.
This measurement is generally expressed in
dBm, normalized to a 1 Hz bandwidth. For convenience, marker and trace
readout shows dBm.
You could display the power in a different
bandwidth using Equation Editor.
dBm/Hz = 10 log10( (DUT Temperature - Receiver Temperature)
* B * 1000) |
where: |
|
|
B
= bandwidth |
|
1000
= conversion from milliwatts |
dB
= 10 log10 (DUT
Temperature - Receiver Temperature)
Noise Model, Noise
Parameters, and the Noise Correlation Matrix
Noise Parameters are models of the noise that is generated in a DUT,
similar to how S-parameters model how RF flows through a DUT.
Noise Model
The noise wave model of any linear 2-port network may be represented
by the following image:
This shows a noiseless 2-port network with noise waves (an1
and bn1)
added to the input terminals. The a1
a2
and b1
b2
are standard S-parameter waves.
The noise correlation matrix relates to the noise waves as follows:
Where:
 are
time-averaged noise power in 1 Hz bandwidth.
are
time-averaged noise power in 1 Hz bandwidth.
 are
time-averaged cross correlation terms, correlation of an1
to bn1.
are
time-averaged cross correlation terms, correlation of an1
to bn1.
Overbars represent time-averaging
Star superscripts represent complex conjugation
Noise Parameters
GammaOpt (Optimum
Complex Reflection Coefficient) - The optimal impedance for the noise
figure measurement. Select the data
format to display GammaOpt
in terms of Log Mag, Lin Mag, Phase, Unwrapped Phase, Real, Imaginary,
Polar, or on a Smith Chart.
NFmin - The minimum noise figure that occurs
at GammaOpt. NFmin
is a scalar quantity that can be displayed as Log Mag, Lin Mag, or
Real.
Rn (Noise Resistance) - Specifies
the rate of change of the level of noise when varying the source impedance.
Rn is a scalar quantity
in units of ohms that should be displayed in Lin Mag or Real format.
NCorr_11, NCorr_21, NCorr_12,
NCorr_22 - The NCorr_11 and NCorr_22
terms are effective noise temperature, normalized to 290 K. Both terms
are time-averaged, noise-wave powers referred to the input of the
DUT, where NCorr_11 is the forward wave (noise going through the device
towards the output), and NCorr_22 is the reverse noise wave (noise
coming out of port 1 of the DUT, going back towards the source).
Standard Parameters that are offered
(Amplifiers-only)
S-parameters:
S11, S21, S22, S12
Unratioed parameters
using the following notation: (Receiver, source port). These parameters
REPLACE the active measurement. To do this (from front-panel
ONLY), press Meas, then [More],
then [Receivers].
(R1,1), (R2,2), (A,1), (A,2), (B,1), (B,2)
Save Noise
Data
To save noise data, click File,
then Save Data As Then
select from the following Save As Types:
(*.prn), (*.cti),
(*.csv), (*.mdf) - Noise Figure data can be saved ONLY with
these choices. PRN saves only the active trace. CITI formatted, CSV
Formatted, and MDF can save all displayed traces. Learn
more about these formats.
(*.s2p) -
Saves S-parameter data only after performing a Noise calibration.
This data is saved regardless of which noise measurement is active
or displayed. Learn more
about *.s2p data.
Trace and Noise parameter
(*.s2p) - Saves S-parameter data, then the Noise
Parameters. This data is saved regardless of which noise measurement
is active or displayed. When the vector calibration is not enabled
or if the noise parameters are not realizable, then the noise parameters
have no calculated value. In this instance, the following values are
displayed instead:
GammaOpt = 0
NFmin = 50
ohm noise figure
Rn= Z0 /
4 * (F - 1). This equation is how Rn
is currently calculated for ill-conditioned data. F is the noise
factor where F is related to the noise correlation value ct11 and the normalized noise
temperature Tn
by F = 1 + ct11 = 1
+ Tn
so that Rn
= (Z0 / 4) x ct11
NoiseCorr (*.nco)
- Saves Noise Correlation data regardless of which noise measurement
is active or displayed. The *.nco file is a noise correlation
matrix expressed in T-parameter form (Ct11,
Ct21, Ct12, Ct22). These parameters are exactly the same as
the Noise parameters NCorr_11, NCorr_21, NCorr_12, NCorr_22
that can be displayed as traces.
When the vector calibration is not enabled, this data
is set to -200 dBm.
How to start the Noise Figure Setup dialog
To provide quicker access, use the Setup softkey. Learn
how. |
Using front-panel
hardkey [softkey] buttons |
Using a mouse
with PNA Menus |
Press Freq then [Noise
Figure Setup] |
Click Response - then Measure
then Noise
Setup |
|
Noise Figure Setup dialog box help |

Note: In
this topic, the term Jitter
is used to describe the trace-to-trace fluctuations in a measurement.
In other topics, this is called 'trace noise'.
Bandwidth/Average
The following settings work together to achieve the optimum
balance of measurement accuracy versus speed:
Noise Bandwidth
Increase the bandwidth
to reduce the amount of trace noise on the noise power or noise
figure measurement (jitter). However, a wider setting reduces
the frequency resolution of the measurement. The noise bandwidth
setting should always be smaller than the bandwidth of the DUT.
The noise bandwidth setting is used only while measuring noise
powers, and is independent from the IF
bandwidth setting used to measure S-parameters. Noise figure
is calculated from noise power and S-parameter measurements.
The calibration
and measurement should be performed using the SAME noise bandwidth.
When the noise bandwidth is changed after calibration, noise figure
measurements can change by 0.5 dB or more, depending on the DUT
frequency range, gain, and noise figure.
Note:
The Noise Bandwidth may be adjusted automatically at low frequencies
according to the following table. At each data point frequency,
if the specified Noise BW is higher than that shown in the table,
the Noise BW is set to the max value in the table.
|
RF
Bands |
|
10
to 25 MHz |
25
to 60 MHz |
60
to 150 MHz |
Above150
MHz |
Noise
Bandwidths Allowed |
.8 MHz
2 MHz |
.8
MHz
2 MHz
4 MHz |
.8
MHz
2 MHz
4 MHz
8 MHz |
.8 MHz
2 MHz
4 MHz
8 MHz
24 MHz |
Note:
Use
Power Meter calibration method is NOT
available when the Noise Bandwidth is 8
MHz or 24 MHz.
Average
Number Increase the number of averages to reduce
jitter. This also reduces measurement speed. For maximum accuracy,
use the following recommendations for the noise calibration. When
using the noise receivers, 10 noise averages is recommended. When
using the standard receivers, at least 100 averages are recommended.
During a measurement, the gain of the DUT
helps overcome the noise of the PNA receivers, so the number of
noise averages can be reduced to improve measurement speed with
minimal or no degradation to measurement accuracy.
Use Narrowband Compensation
The mathematics of noise figure assumes
that the gain of the DUT is constant over the bandwidth of the
noise receiver. The following image illustrates a case in which
the gain (S21) of the DUT falls off sharply outside the passband
region. When the PNA measures noise figure at the frequency indicated
by the solid vertical line using a 4 MHz noise bandwidth, standard
noise figure calculations assume the gain to equal its midpoint
value (dashed horizontal line) over the entire 4 MHz bandwidth.
This assumption yields a composite gain-bandwidth value that is
lower than the actual value, which in turn results in a noise
figure value that is too high. This is the reason for the bump
in the displayed NF value at this frequency and surrounding frequencies.
In the following image, Narrowband
Compensation combines DUT measurements with characteristics of
the noise receiver, which accommodates changes in DUT gain over
the receiver bandwidth. The result is a better gain-bandwidth
value of the system. Notice how the peaks and valleys of the NF
measurement disappear when narrowband compensation is applied.
Notes on using Narrowband Compensation:
Can be used with either option 028 (Noise
figure measurements using standard receivers) or 029 (Fully
Corrected Noise Figure).
With option 029 (NF receiver) Narrowband
Compensation is available only for the 800 kHz, 2 MHz,
and 4 MHz noise bandwidths. With option 028 (Standard PNA receivers)
you MUST re-configure
the front panel loops. Learn
how. Can be used with both Scalar and Vector NF
calibrations, on either NF or NFX channels. The ON / Off state has no effect on calibration.
In other words, it does not matter if Narrowband Compensation
is On or Off while a noise calibration is being performed. Is applied only when corrected DUT measurements
are made. If correction is turned off, it has no effect. Can be ON or Off while the NF channel is in
Hold mode, and it will modify the NF trace appropriately.
There is no need to re-sweep.
Noise Receiver
NA (Network Analyzer) Receiver
(Opt 028) - Use a standard PNA receiver to measure noise figure.
Connect the DUT to any PNA ports. For vector
noise figure measurements, connect
the noise tuner to the source port. The gain plus noise figure of the DUT minus
cable loss must be at least 40 dB (G+
NF - Loss > 40 dB). This ensures that there is sufficient
DUT noise power for the PNA to measure. Learn
more. Additional filtering may be required. Learn
more.
Noise Receiver (Opt
029) - Use internal low-noise receivers to measure noise figure.
Opt 029 measures devices with noise figure
values ranging from about 0 to 50 dB and devices with GAIN
ranging from about -40 to +60 dB. Learn
more. Amplifiers with higher gain can be measured
by adding an attenuator to the output of DUT and using fixture de-embedding
to remove the attenuator loss. An alternative for measuring
high-gain devices is to use the standard receivers (Opt 028)
as they have a higher compression level.
Receiver Gain
This setting is NOT available when Noise Receiver is set to
NA (Network Analyzer) Receiver
(Opt 028).
With knowledge of your DUT gain, set the appropriate amount
of receiver gain in order to optimize the power level at the noise
receiver.
The following values reflect the SUM of the DUT gain (dB) PLUS NF (dB). For example: DUT
gain = 20 dB; NF = 10 dB; SUM = 30 dB.
Select High
if the SUM is relatively low (<30 dB). Select Medium
if the SUM is about average (20 dB to 45 dB). Select Low
if the SUM is relatively high (>35 dB).
There is considerable overlap in these settings. Because all
three gain settings are calibrated with each Noise Calibration,
this setting can be changed after calibration to achieve the least
amount of jitter without overpowering the noise receiver.
One of following messages appears when too much power is detected
at the noise receiver:
Compression
in noise receiver: excess signal - The noise receiver
is likely compressing. NF results are possibly not accurate.
Select a lower gain setting. Compression
in noise receiver: gain has been limited - The gain
has been limited to avoid damage to the receiver. NF results
are NOT accurate. Select a lower gain setting. ADC over-range
in noise receiver: excess signal - Often caused by
a CW signal, an oscillation, or LO feedthru during an NF measurement.
Find and correct the cause, or try a lower gain setting.
Only ONE gain setting can be used for the entire frequency range
of your noise measurement. Therefore, it may be necessary
to use two noise channels with different frequency ranges and
gain settings to achieve the very highest noise figure accuracy.
Ambient Temperature
Note: This
setting is only used for calibrated noise figure measurements,
but has no effect in an uncalibrated noise figure channel. The
default value is used for uncalibrated measurements.
Enter the equivalent port
1 temperature at the time of the measurement, in Kelvin (K). One
can use a thermometer to measure the temperature of the input
cable.
In
the case of full vector correction, it is the temperature of the
Ecal Tuner (31 °C or 304.15K) minus the loss effect of the cable
from the tuner to the DUT; both internal and external Ecals used
as tuners have the same internal heater to heat to 31 °C.
For
scalar it is the temperature of the internal load (such as the
internal step attenuator) minus the loss of the cable, typically
around 297K.
The
cable loss compensation is computed from Tambient_setting=Tpna_source*|S21|^2+(1-|S21|^2)*Tcable where
S21 is the loss of the port 1 cable, Tcable is the temperature
of the cable, and Tpna_source is the temperature of the either
the Ecal used as a tuner, for full vector, or the temperature
of the internal load for scalar calibration. Tecal is typically
304.15K; the internal load is typically around 297K (if the attenuator
internally is set to 10 dB or more) or 303K if the internal source
attenuator is set to 0. The attenuator is physically located
near the input of the air flow and so it is very close to the
external ambient temperature, but with 0 dB setting, the temperature
of the internal source becomes the effective input temperature
and it is a little warmer at about 6 degrees rise above ambient.
This
ambient temperature number has an inverse relationship to the
noise figure. When using the effective noise temperature
(Te) format, a 3 degree increase in the ambient temperature will
make the calibration measurement result drop 3 degrees, which
will then have an effect on subsequent noise figure measurements. One
can directly measure the port 1 equivalent temperature by connecting
port 1 to port 2 with a low loss through, and measuring the mean
value directly. Because the noise value is quite low, averaging
or using trace statistics should be used to find this value.
Impedance States
Noise Tuner
Displays the ECal module to be used as a noise tuner. Select
the Noise Tuner during calibration on the Select
Cal Method dialog.
Max Acquired
Impedance States Select the number of impedance states
in which to make noise measurements. At least FOUR impedance states
are required. Learn more.
|
Frequency Tab - Noise Figure
dialog box help |
These settings can also be made from the normal PNA setting
locations. Click links below to learn how.
Sweep Type
Choose a sweep type. Learn
more.
Segment
Sweep Notes:
Sweep Settings
Click each to learn more about these settings.
|
Power Tab - Noise Figure dialog
box help |

Note: S-parameter
power settings are critical for accurate noise figure measurements.
See Noise Figure Measurement Tips.
Configures RF power settings for the S-parameter measurements
that occur before noise measurements. Input power to the DUT is
turned OFF during noise measurements.
These settings can also be made from the normal Power
setting locations.
Power ON (All channels)
Check to turn RF Power ON for all channels.
DUT Input Port
Opt 028 - Select a PNA port to be connected
to the DUT input.
Opt 029 Scalar
Noise Figure - Select a PNA port other than port 2.
Opt 029 Vector Noise Figure - The DUT input
CAN be connected to any PNA port other than port 2. However, without
a noise tuner bypass switch, measurements on other channels that
use the same source port will always go through the noise tuner.
The noise tuner must be connected to the source loop of the selected
port.
Note:
Input power levels are critical for accurate noise figure measurements.
Learn more.
Power Level
The input power to the DUT during S-parameter measurements.
Source
Attenuator Auto Check to automatically select the
correct attenuation to achieve the specified input power. Clear,
then select attenuator setting that is used achieve the specified
Power Level. Learn
more about Source Attenuation.
All PNA channels in continuous sweep must
have the same attenuation value. Learn
more.
Receiver
Attenuator Specifies the receiver attenuator setting
for port 1.
Source
Leveling Specifies the leveling mode. Choose
Internal. Open Loop should only be used when doing Wideband
Pulse measurements (not available with Noise figure measurements).
DUT Output Port
Opt 028 - Select a PNA port to be connected
to the DUT output.
Opt 029 - Connect the DUT output to PNA
port 2.
Output
Power Sets power level in to the output port for
reverse sweeps. Port power is automatically uncoupled. Reverse
sweeps are always applied to the DUT when Full 2-port correction
is applied. Enhanced
Response Cal is NOT available for noise figure measurements.
Source
Attenuator Specifies the source attenuator setting
for reverse power.
Receiver
Attenuator Specifies the receiver attenuator setting
for the output port. Learn
more about Receiver Attenuation.
Source
Leveling Specifies the leveling mode. Choose
Internal. |
Noise
Path Configurator - dialog box help |
26.5 GHz Models
50 GHz Models (Opt. 029)
Port 1 Noise Tuner Switch
(Opt 029)
26.5 GHz
The orange line between CPLR THRU and SRC OUT represents the
Noise Tuner.
See
Important Notes about
managing this switch.
50 GHz Models
Port 2 Noise Receiver Switch
(Opt 029 All models) allows
you to make Noise Receiver measurements.
To prevent premature wear on the above two Noise switches, the
PNA does not allow these switches to be thrown when sweeping a
Noise channel and non-Noise channel. To make noise figure measurements
and non-noise figure measurements in different channels and continuously
trigger both, set these switches to the same state as the Noise
channel:
With the non-noise
figure channel active, go to Noise
Path Configurator. Set Noise Tuner switch to External.
This routes source power to the front-panel loops, and
to the Noise Tuner when connected. Use CONT:ECAL:MOD:PATH:STATE
to set the internal state of the Noise Tuner to THRU, which
creates a small amount of additional loss in the source path. Set Noise Receiver Switch to Noise
Receiver. |
Noise Figure Measurement Tips
Note: In this topic,
the term Jitter is used to describe
the trace-to-trace fluctuations in a measurement. In other topics, this
is called 'trace noise'.
Option 029
See
Opt 028 (NF with Standard Receiver)
Measures devices with noise figure values ranging
from about 0 to 50 dB and devices with GAIN ranging from about -40
to +60 dB.
Highest noise figure accuracy is attained when the
sum of device noise figure + GAIN is between 0 dB to +70 dB.
For highest noise figure accuracy and stability, there
should be the least amount of electrical loss possible between the
DUT output and PNA Port 2.
Power level at the DUT Output - Opt 029
S-parameters are used to measure the gain of the DUT before each series
of noise measurements. Jitter in the S-parameter measurements corresponds
directly to jitter in the noise measurements.
For best noise figure accuracy, the power level out of the DUT should
be between 15 dB and 20 dB below the compression point of the DUT during
the S-parameter portion of the noise figure measurement.
To reduce jitter, the power level at the B receiver (port 2) should
be above approximately -20 dBm. Much below this level, S-parameter measurements
have more jitter. Power must be below +10 dBm as the B receiver starts
to compress at this point, although there is no warning or annotation
that shows this condition is occurring in S-parameter measurements.
The best way to monitor power at the B receiver is to display a B,1
measurement. With your DUT in place and powered ON, change the input
power to the device and note the power at the B receiver.
For low-gain DUTs, use 5 dB of source attenuation
to improve the uncorrected match of port 1.
For high-gain DUTs, source and receiver attenuation
may be required. Use the lowest possible attenuation values.
Attaining the optimum power level during
calibration can also be challenging since calibration is performed
without the DUT in place. Because of this, it is often necessary to set
source power higher during the calibration than during the measurement.
This will cause the 'CD' annotation on the
status bar. Measurement results are accurate as long as the step attenuators
and other configuration switches are in the same position and all receivers
remain in their linear range (below +10 dBm).
It is best to find the optimum power and attenuation settings for both
the calibration and subsequent noise measurements before
performing a calibration.
IF Bandwidth
Jitter is further reduced by narrowing the IF bandwidth. If the calibration
needs to be performed at a low source power, or with receiver attenuation
due to high DUT gain, the IF bandwidth should be reduced during the calibration
to reduce jitter. The IF bandwidth can then be increased to improve measurement
speed. The CD annotation can be
ignored when changing IFBW after calibration.
Noise Settings
See Noise Figure dialog box help
for a complete description of these important settings.
Temperature
Noise Figure measurements are extremely sensitive to temperature. As
such, there are two settings that require an accurate temperature measurement:
At the DUT input, and
at the Noise Source connector.
Interference
When measuring the noise figure of an unshielded device, like an amplifier
on a printed-circuit board, it is very common to pick up interference
from external signals such as cellular phones, wireless LAN, or mobile
radios. This interference shows up as non-repeatable spikes in the measurement,
as shown below.
Usually, the interference adversely affects the noise figure measurement
only at the frequency where it occurs. However, if the interference is
large enough and present all of the time, it can cause the noise receivers
to compress, which results in inaccurate measurements at many frequencies.
In this case, the noise figure measurements should be done in a shielded
environment like a screen room.
Option 028
Noise Figure of PNA receiver -
Option 028 gives you the flexibility to measure noise figure using a standard
PNA receiver. For best measurement accuracy, the DUT excess noise power,
which is gain plus noise figure minus cable loss in dB (G + NF - Loss),
should meet or exceed the noise figure of the receiver. This is generally
not a problem with very high-gain devices such as converters with approximately
60 dB of gain.
If your DUT is NOT a very high-gain device, you can re-configure the
PNA front panel loops to increase receiver sensitivity.
Re-configuring the front panel loops
- This configuration reverses the main arm and coupled arm of the test-port
coupler (see following images). This increases the signal to the receiver
port by about 15 dB, while lowering the available port power by the same
amount. This is a good tradeoff for noise figure measurements.
Block diagram showing port 2 thru
coupler main arm to B receiver. |
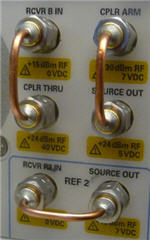
Configure the receiver
port front-panel loops to a vertical orientation as shown
here. |
The following table shows the excess
noise that is required at various
frequencies. These values assume the front-panel loops have been re-configured
as shown above:
Frequency
range |
Required
Excess Noise Power |
Up
to 20 GHz: |
30
dB |
Up
to 50 GHz: |
40
dB |
Up
to 67 GHz: |
45
dB |
For devices that do NOT meet this requirement, a low-noise amplifier
(LNA) must be added to the receiver loop (see following image). This boosts
the noise power at the receiver by the gain of the LNA. The disadvantage
is the possibility of measurement drift and receiver compression. Any
change in the gain of the LNA will have an impact on measurements that
use the receiver with the LNA, so frequent calibration may be required.
Care should also be taken when setting the channel power (used during
the S-parameter portion of the calibration, and the gain portion of the
DUT measurement) to ensure that the added gain of the LNA does not cause
receiver damage or compression. A filter is also required on the output
of the LNA. Learn more.
Filtering Requirement (Option
028)
Opt 029 includes noise receivers with filtering to keep mixing-product
noise out of the low-noise receivers. These filters are not available
when measuring noise with the standard PNA receiver. Therefore, for best
measurement accuracy, a filter should be used at the output of the DUT
(or LNA preamp if used).
A bandpass filter at the frequencies of interest can
always be used.
A lowpass filter can be used when the PNA is doing
fundamental mixing (up to 26.5 GHz). The lowpass filter must pass
the fundamental frequency of the measurement but suppress the third
harmonic. A measurement at 1 GHz would need a lowpass filter with
a cutoff below 3 GHz, while a 5 GHz measurement would need a filter
with a cutoff below 15 GHz.
A single highpass filter can often be used when the
PNA is doing 3rd-harmonic mixing (from 26.5 to 67 GHz). Use a highpass
filter with cutoff about 18 GHz for frequencies up to 50 GHz. For
operation to 67 GHz, the filter cutoff would need to be above 23 GHz.
Using Noise
Figure Traces in Equation Editor
In a Noise Power trace,
the underlying unit is noise temperature.
10*log10( temperature * 1000mw/w * 1.38e-23)
(1.38e-23 is Boltzmanns constant)
Any time you use Equation Editor on a Noise Power trace, the LogMag
formatting will apply the above equation. Therefore, first select
REAL format and then generate
the equation.
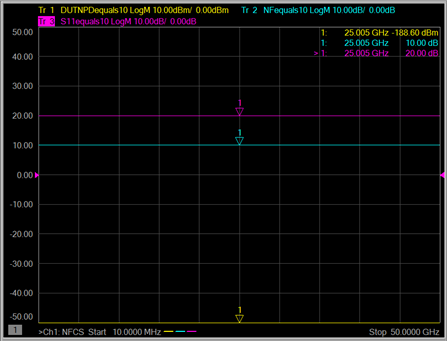
The following screen is an example showing three traces: DUTNPD (DUT
Noise Power Density), NF (Noise Figure), and S11 with the equation set
to "***=10". Note that formatting for noise figure measurements
is different than noise power measurements or temperature measurements.
Radio-Frequency
Electromagnetic Field Immunity
When a 3Vm-1 radio-frequency electromagnetic field is applied
to an PNA with Opt 029 according to IEC 61000-4-3:1995, degradation
of performance may be observed. When the frequency of the incident
field matches the frequency of a measured noise figure or gain,
the values displayed will deviate from those expected. This phenomenon
will only affect that specific frequency, and the analyzer will
continue to perform to the specification at all other frequency
sample points.
The PNA with Opt 029 may be unable to calibrate a chosen frequency
sample point if the frequency matches that of an incident electromagnetic
field. |