Noise Figure Application
Note: (M937xA, P937xA) This function is not supported.
Note: (M980xA, P50xxA/B) Noise Figure can be measured between 50 MHz and 45 GHz. (M983xA) Noise Figure can be measured between 50 MHz and 44 GHz.
The Noise Figure Application makes fast, easy, and accurate noise figure measurements. This function is available with S9x029A/B.
The information presented in this topic pertains to Noise Figure measurements on BOTH Amplifiers and Converters unless stated otherwise.
See Also
Noise Figure Calibration
Noise Figure on Converters (NFX)
Programming commands
Noise Figure and TRL Cal
Example Setup for U7229x Amplifier Control
See other VNA Applications
Noise Figure Hardware and Software Options Explained
Noise Figure Application Features
-
Cold noise method includes correction for imperfect system source match for highly accurate noise figure measurements.
-
Measure noise figure of frequency translating devices. Learn more.
-
During calibration, ENR values are interpolated for frequencies between the supplied data points.
Noise Figure Application Requirements
-
Noise Tuner - Required for vector noise figure measurements. Not required for scalar noise figure.
-
-
Power Meter - Required when calibrating NFX (Noise Figure on Converters).
-
Recommended: An accurate thermometer. Learn more.
-
MM Head: The N5290A or N5291A broadband millimeter heads may be used to measure noise figure. This feature must be used in conjunction with a broadband amplifier such as the U722xx series amplifiers, and the use of the macro feature (SENS:NOIS:SWE:MACR). Careful physical setup including filters may be necessary. The feature may be accessed by SCPI only (SENSe<ch>:NOISe:RECeiver <char>).
Noise Source
Note: Support for U1832X and U1833X Noise Sources is a Licensed Feature. Learn more about Licensed Features.
When using a Noise Source, the following requirements apply:
-
The 346C Noise Source (recommended) produces ENR values to 26.5 GHz.
-
The 346B Noise Source can be used up to 18 GHz.
-
The 346A Noise Source can also be used up to 18 GHz, but requires more averaging for calibration.
-
The 346C K01 (50 GHz) Noise Source typically has about 6 dB of ENR at 50 GHz which may NOT yield an adequate calibration, depending on how many noise averages are used. An alternative approach calibrates the noise receivers using a power sensor-based method. Select Use Power Meter for the noise figure calibration. .
-
The U1831C Noise Source can be used up to 26.5 GHz.
-
The U1832(A/B/C/D) and U1833(A/B/C/D/G) Noise Sources can be used.
-
A: 26.5GHz, B: 50GHz, C: 50GHz, D: 55GHz, G: 67GHz
-
U1832X: Low ENR models
-
U1833X: High ENR models
-
An adapter may be necessary to connect the Noise Source to the VNA port 2 reference plane during calibration. Cal Kit (or second ECal module) with same connector type and gender as DUT connectors.
|
Limitations with the Noise Figure Application
The following features are NOT supported in a noise figure channel:
Noise Concepts
The following conceptual information is a short summary taken from the Keysight Noise Figure App Note 57-1.
All electronic circuits have some degree of random noise. The most common form is thermal noise, which increases as the temperature of the circuit increases.
The signal-to-noise (S/N) ratio of components in a communications system is a very important parameter. To improve the S/N ratio, it is usually easier and more cost-effective to reduce noise than to increase signal power. In order to reduce noise, an accurate method to measure noise is required.
Noise Figure
Noise Figure is the degradation in the signal-to-noise ratio as a signal passes through a device. For example, in the following images:
|
|
|
(a) At the INPUT of the DUT:
The noise floor is -100 dBm, the signal is at -60 dBm, 40 dB above the noise floor.
|
(b) At the OUTPUT of the same DUT:
The gain has boosted the signal AND the noise floor by 20 dB.
The DUT then added 10 dB of its own noise.
The output signal is now only 30 dB above the noise floor.
Since the degradation in signal-to-noise ratio is 10 dB, the DUT has a 10 dB noise figure.
|
For consistency, noise measurements are calculated as if using a 1 Hz bandwidth, although measurements are almost always made at higher bandwidths.
The following formula shows the lowest possible noise power in dBm at 290° K (room temperature). The only way to measure noise lower than this is to make the measurement at a lower temperature.
How the Noise Figure Application Works
The goal of the noise figure application is to accurately measure the noise that is generated by the DUT.
The standard receivers are always calibrated using a power meter and a measurement of the receivers effective noise bandwidth. Learn more about the noise calibration process.
Some noise measurement error is caused by a poor source match presented to the DUT input. Therefore, during every measurement, the noise figure application uses an ECal module to present at least four different impedances at the input of the DUT. This "Noise Tuner" is connected to the VNA port 1 or port 2 . From the measurements at various impedance states, the VNA calculates the noise out of the DUT as though the VNA were exactly 50 ohms. No assumptions are made regarding the input impedance of the DUT.
Here is how a vector noise figure measurement is made using Option 029. The sweep numbers are annotated on the VNA display as they occur.
-
With the noise tuner in the THRU state, S-parameter measurements are made to accurately characterize the gain of the DUT. This requires sweeps in both forward and reverse directions. (sweep #1 and #2).
-
The noise measurements are performed next. VNA source power is turned OFF and the noise tuner is switched to the first impedance state.
-
At each frequency, the noise receiver samples a large number of readings in order to attain one valid measurement. If Noise Averaging is selected, the specified number of measurements are made and averaged together to obtain one noise measurement. This continues for all frequencies (sweep #3).
-
The next noise tuner impedance state is switched IN and the noise measurements in step 3 are repeated. This occurs until measurements are made at all impedance states. At least four impedance states must be used. (sweeps #4, #5, #6+)
-
Calibration error terms are applied and calculations made to simulate the measurement with a perfect 50 ohm input impedance. The sweep result is plotted on the VNA display.
-
The VNA begins sweeping again with step 1.
Scalar Noise Figure Measurements
Note: M9485A does not support the noise tuner.
As described above, the noise tuner is switched to at least four different impedance states before a sweep is plotted. These sweeps are NOT made in a scalar noise figure measurement, resulting in much faster measurements. Of course, a scalar noise figure measurement is NOT as accurate as a vector noise figure measurement because scalar noise figure measurements assumes that all impedances are 50 ohms. Measurement accuracy can be improved by adding an attenuator as close to the DUT input as possible. This improves the effective system source match. The effect of the attenuator loss is removed during the calibration process.
With scalar noise figure, it is not necessary to connect the noise tuner. If a noise tuner remains connected, it is switched to the THRU state for scalar noise figure measurements. This results is a small amount of loss which slightly degrades measurement accuracy. To increase measurement accuracy, manually switch the noise tuner switch to the INTERNAL position. Learn how.
Select Scalar Noise at the first page of a Noise Figure calibration.
M980xA, P50xxA/B External Switch Setup
When you make a Noise Figure measurement with the M980xA, P50xxA/B, the external source switch is required to avoid inputting the noise into DUT from the source signal.
Scalar Noise Figure Setup
Note: The switch modules M9155/56/57C(H40) are also supported.
Vector Noise Figure Setup
The Noise Tuner is required for vector noise figure measurements. See Noise Tuner requirements
Harmonic Mixing Rejection Filter
It is recommended to place filters at the receiver port. The required characteristic is shown below. Both high and low pass filters are required above 20 GHz.
|
Measurement Frequency
|
High pass filter
|
Low pass filter
|
|
50 MHz <= frequency <= 20 GHz
|
Not required
|
Passband < 2.7 × frequency
|
|
20 GHz < frequency <= 45 GHz
|
Passband > 0.7 × frequency
|
Passband < 1.2 × frequency
|
If the filter is not placed, the noise at the harmonic frequencies may be added up on the measurement result and causes the inaccurate result.
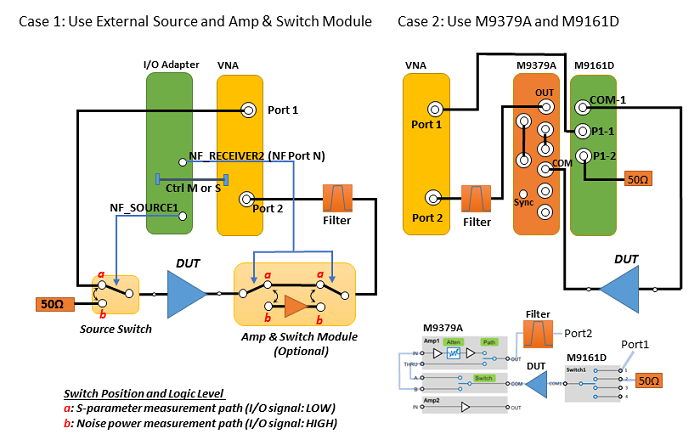
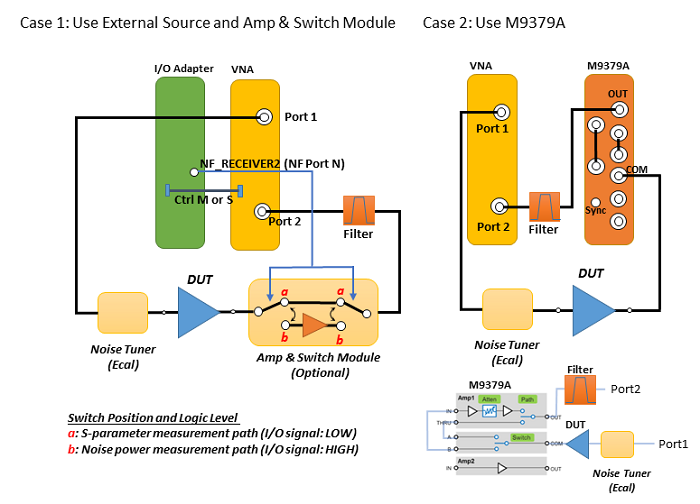
Case 1
The external source switch is controlled by I/O Adapter. So that, the path a should be selected during S-parameter measurement and The path b is selected during noise power measurement. Amp & Switch module can be used in order to improve the noise figure measurement sensitivity
Recommended Noise Source and Pre-Amplifier Gain
|
Input noise power at receiver input port (*1)
|
External preamp gain (*2)
|
|
For noise source calibration (*3)
|
For power meter calibration
|
|
<-23 dBm
|
15 dB to 28 dB
|
< 16 dB
|
(*1) For example, DUT(gain =20 dB, NF= 5 dB, Frequency span=10 GHz) with 25 dB gain external preamp will output -24 dBm noise power.
(*2) When M9379A is used as external preamp, select configuration(1-stage or 2-stage) and internal ATT setting appropriately to avoid unexpected receiver compression during calibration and measurement.
(*3) Recommend to use 346B or 346C (nominal ENR = 15 dB).
Case 2
When you use M9379A RF Amplifier module (<= 13.5 GHz), you can setup a Noise Figure measurement more easily. The VNA firmware can control each module automatically.
Example:
The M9379A Out is connected with port N (N=2, 3, ...)
RF Amplifier Module Control Setup: PATH > NF Receiver , Switch > NF Receiver, Atten > 0 dB (Recommended)
M9834/37A Noise Figure Setup

The Noise Tuners, N4693D Ecal, required for vector noise figure measurements. See Noise Tuner requirements
The bandpass filter is recommended to place the output of DUT in case of 40 to 44 GHz. The recommended bandpass filter is Marki FB-4000.
Using the Noise Figure Application
Use the following general procedure to make noise figure measurements:
-
Connect Tuner and Noise Source.
-
Create a Noise Figure Measurement.
-
Make Noise Figure Settings.
-
copy your Noise Source ENR file to the VNA "C:\Program Files(x86)\Keysight\Network Analyzer\Noise folder"
-
Perform Calibration
-
Connect the DUT. Learn more about DUT input and output ports.
-
Measure Noise Figure.
-
Optional Click File, then Save to save noise figure data. Learn more.
N524xx Connect Noise Tuner and Noise Source
-
Connect the noise source and DC source.
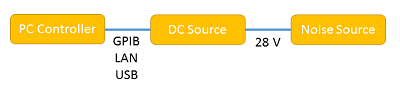
-
Configure the DC source using Configure a DC Device.
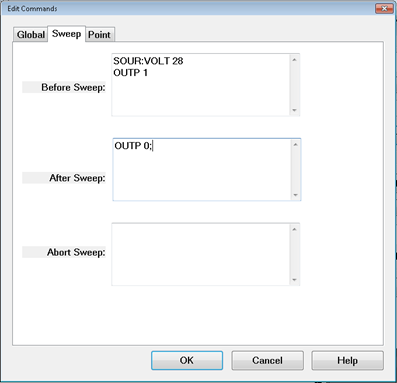
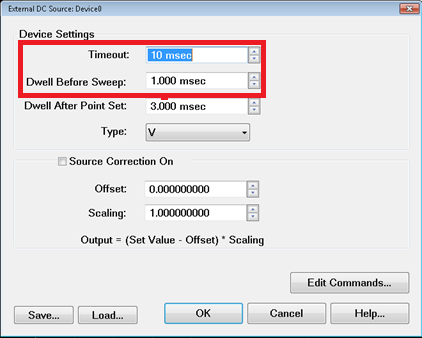
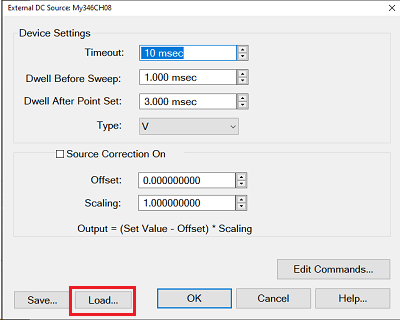
Click Device Properties to set up waiting time and commands as required.
Click Device Properties to set up waiting time and commands as required.
Set “Timeout” and “Dwell Before Sweep”. VNA doesn’t use other settings for noise source control.
Setup 346C with 346CH08 USB Adapter
-
Install the 346CH08 parser software. (Download site )
-
Connect the 346C DC source and 346CH08 USB adapter.
-
Connect the 346CH08 with the USB port on PC or analyzer.
-
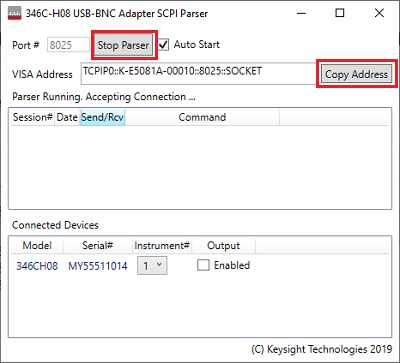
Launch the 346C-H08 SCPI Parser from Windows Menu
-
Check "Auto Start" and Set the Instrument#.
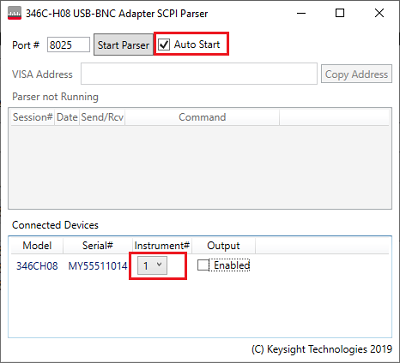
-
Click "Start Parser" to start parser and click "Copy Address"
-
Open or launch the VNA Firmware.
-
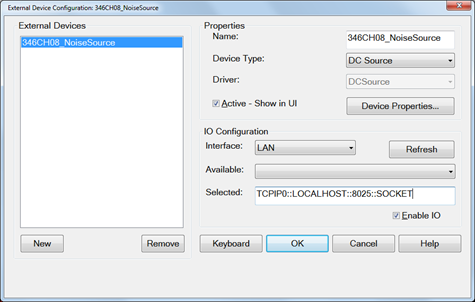
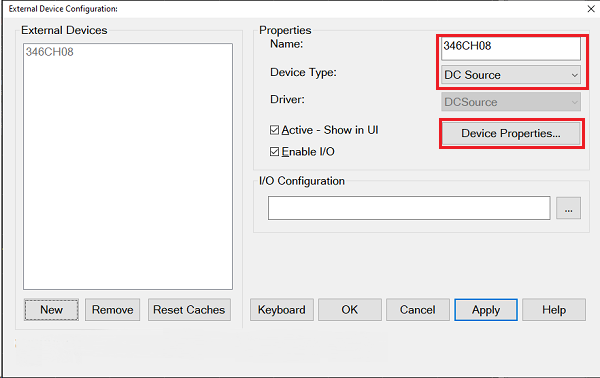
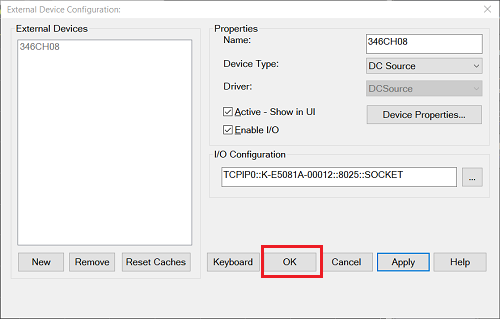
Click Setup > External Hardware > External Device...
-
Specify device name and select DC Source as Device Type.
-
Click Device Property.
-
Import 346CH08.xml. The xml file is located under C:\Users\Public\Documents\Network Analyzer\Drivers. Click OK to close this dialog box.
-
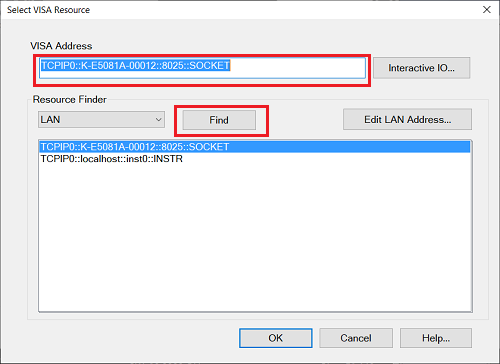
Click ... in the IO Configuration.
-
Paste the VISA Address from the SCPI parser or find the VISA address on LAN (Not USB).
-
Click OK to save the setup.
Create a Noise Figure Measurement
-
On the VNA front panel, press Meas > S-Param > Meas Class....
-
Select Noise Figure Cold Source, then either:
-
A noise figure measurement is displayed. The following shows how to select or change displayed parameters.
Noise Parameters
Several noise parameters, as well as standard parameters, can be measured in the same Noise channel.
How to add Noise Parameters
-
Create a Noise Figure channel.
-
Then do the following:
|
|
Using Hardkey/SoftTab/Softkey
|
Using a mouse
|
-
Press Trace > Trace N > Trace N.
-
Press Trace > Trace Setup > Measure....
|
-
Click Instrument
-
Select Trace
-
Select Add Trace
-
Click Instrument
-
Select Trace
-
Select Measure...
|
How to CHANGE Noise Parameters
-
Create a Noise Figure channel.
-
Select the parameter to change.
-
Then do the following:
|
-
Select a trace by pressing Trace > Trace N > Trace N.
-
Press Trace > Trace Setup > Measure....
-
Select a parameter.
|
-
Right-click on a trace.
-
Select a parameter
|
|
Programming Commands
|
Noise Measurements that are offered
The following three categories of noise measurements can be made with the VNA:
-
Noise Figure is the amount of noise that the DUT is adding in a 50 ohm test setup. This is explained in detail in Noise Concepts.
-
Noise Power Parameters show the amount of noise coming out of the DUT in a 50 ohm test setup. With gain measurements of the DUT, these noise power parameters are used to calculate noise figure.
-
Noise Parameters are models of the noise that is generated in a DUT, similar to how S-parameters model how RF flows through a DUT.
ENR (in dB) = 10 log10((Thot - Tcold) / T0), where T0 = 290K.
Learn more about the ENR table and Noise Source. Learn more about Noise Source ENR measurements.
290°° K = -174 dBm/Hz.
|
Te is the unknown variable
|
|
|
|
Available Gain Ga is a function of S11, S22, and Γs
|
Noise Power Parameters
The Noise Power parameters below are offered in the following two formats:
-
Available Noise Power The calculated power that is based on an ideal impedance match at the output of the DUT. These parameters have always been offered in the VNA noise figure App.
-
Incident Noise Power - An 'I' is appended to the end of the Available Noise Power parameter. The calculated power into a perfect 50 ohm noise receiver, regardless of the output impedance of the DUT.
-
SYSNPD / SYSNPDI - System Noise Power Density: Total noise power available at the ADC, including the noise contributed by both the DUT and the internal noise receiver. This is generally expressed as an absolute power measurement in dBm, but can also be expressed in Watts or Kelvin.
|
dBm = 10 log10(k * T * B * 1000)
|
|
where:
|
|
|
|
k = Boltzmann's constant
|
|
|
T = the measured noise temperature
|
|
|
B = bandwidth
|
|
|
1000 = conversion from milliwatts
|
dB = 10 log10(T/290)
-
DUTNPD / DUTNPDI - DUT Noise Power Density: When correction is ON, this trace exhibits the available noise power, best described as the maximum power available from the DUT where the impedance of the noise port is equal to the output match of the DUT. To be more precise, this occurs when the noise port match is equal to the conjugate of the output match of the DUT. The noise power contributed by the receiver is removed.
When correction is OFF, the trace exhibits what is more accurately described as delivered power. Delivered power is the power actually seen by the ADC. Any mismatch between the receiver and the DUT is ignored. The noise power contributed by the receiver is removed.
This measurement is generally expressed in dBm, normalized to a 1 Hz bandwidth. For convenience, marker and trace readout shows dBm.
You could display the power in a different bandwidth using Equation Editor.
|
dBm/Hz = 10 log10( k * (System Temperature - Receiver Temperature) * B * 1000)
|
|
where:
|
|
|
|
B = bandwidth
|
|
|
1000 = conversion from milliwatts
|
dB = 10 log10 ((System Temperature - Receiver Temperature) / 290)
Noise Model, Noise Parameters, and the Noise Correlation Matrix
Noise Parameters are models of the noise that is generated in a DUT, similar to how S-parameters model how RF flows through a DUT.
Noise Model
The noise wave model of any linear 2-port network may be represented by the following image:
This shows a noiseless 2-port network with noise waves (an1 and bn1) added to the input terminals. The a1 a2 and b1 b2 are standard S-parameter waves.
The noise correlation matrix relates to the noise waves as follows:
Where:
-
 are time-averaged noise power in 1 Hz bandwidth.
-
 are time-averaged cross correlation terms, correlation of an1 to bn1.
-
Overbars represent time-averaging
-
Star superscripts represent complex conjugation
Noise Parameters
-
GammaOpt (Optimum Complex Reflection Coefficient) - The optimal impedance for the noise figure measurement. Select the data format to display GammaOpt in terms of Log Mag, Lin Mag, Phase, Unwrapped Phase, Real, Imaginary, Polar, or on a Smith Chart.
-
NFmin - The minimum noise figure that occurs at GammaOpt. NFmin is a scalar quantity that can be displayed as Log Mag, Lin Mag, or Real.
-
Rn (Noise Resistance) - Specifies the rate of change of the level of noise when varying the source impedance. Rn is a scalar quantity in units of ohms that should be displayed in Lin Mag or Real format.
Note: Rn, as a measurement parameter, is not normalized. When the value of Rn is written to an S2P file, it is normalized (Rn / Zo). When an S2P file is recalled, the normalized Rn is multiplied by the system impedance to obtain Rn.
-
NCorr_11, NCorr_21, NCorr_12, NCorr_22 - The NCorr_11 and NCorr_22 terms are effective noise temperature, normalized to 290 K. Both terms are time-averaged, noise-wave powers referred to the input of the DUT, where NCorr_11 is the forward wave (noise going through the device towards the output), and NCorr_22 is the reverse noise wave (noise coming out of port 1 of the DUT, going back towards the source).
-
Standard Parameters that are offered (Amplifiers-only)
-
S-parameters: S11, S21, S22, S12
-
Unratioed parameters using the following notation: (Receiver, source port). These parameters REPLACE the active measurement. To do this (from front-panel ONLY), press Meas, then [More], then [Receivers].
-
-
(R1,1), (R2,2), (A,1), (A,2), (B,1), (B,2)
Save Noise Data
To save noise data, click File, then Save Data As Then select from the following Save As Types:
-
(*.prn), (*.cti), (*.csv), (*.mdf) - Noise Figure data can be saved ONLY with these choices. PRN saves only the active trace. CITI formatted, CSV Formatted, and MDF can save all displayed traces. Learn more about these formats.
-
(*.s2p) - Saves S-parameter data only after performing a Noise calibration. This data is saved regardless of which noise measurement is active or displayed. Learn more about *.s2p data.
-
Trace and Noise parameter (*.s2p) - Saves S-parameter data, then the Noise Parameters. This data is saved regardless of which noise measurement is active or displayed. When the vector calibration is not enabled or if the noise parameters are not realizable, then the noise parameters have no calculated value. In this instance, the following values are displayed instead:
-
-
GammaOpt = 0
-
NFmin = 50 ohm noise figure
-
Rn= Z0 / 4 * (F - 1). This equation is how Rn is currently calculated for ill-conditioned data. F is the noise factor where F is related to the noise correlation value ct11 and the normalized noise temperature Tn by F = 1 + ct11 = 1 + Tn so that Rn = (Z0 / 4) x ct11
-
NoiseCorr (*.nco) - Saves Noise Correlation data regardless of which noise measurement is active or displayed. The *.nco file is a noise correlation matrix expressed in T-parameter form (Ct11, Ct21, Ct12, Ct22). These parameters are exactly the same as the Noise parameters NCorr_11, NCorr_21, NCorr_12, NCorr_22 that can be displayed as traces.
-
When the vector calibration is not enabled, this data is set to -200 dBm.
How to start the Noise Figure Setup dialog
|
|
Using Hardkey/SoftTab/Softkey
|
Using a mouse
|
-
Freq > Main > NF Setup....
|
-
Click Stimulus
- Select NF Setup...
|
|
Programming Commands
|
|
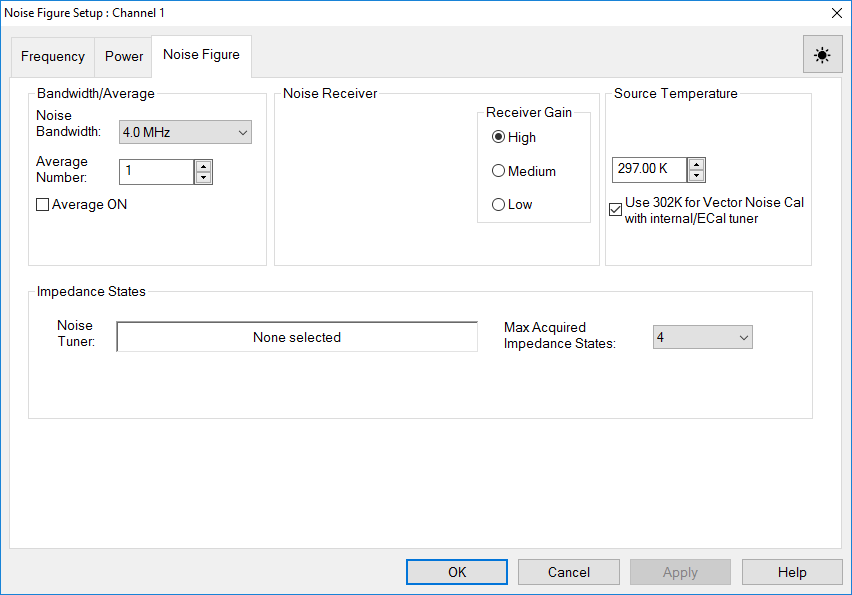
Noise Figure Setup dialog box help
|
|
Note: In this topic, the term Jitter is used to describe the trace-to-trace fluctuations in a measurement. In other topics, this is called 'trace noise'.
Bandwidth/Average
The following settings work together to achieve the optimum balance of measurement accuracy versus speed:
Noise Bandwidth Increase the bandwidth to reduce the amount of trace noise on the noise power or noise figure measurement (jitter). However, a wider setting reduces the frequency resolution of the measurement. The noise bandwidth setting should always be smaller than the bandwidth of the DUT. The noise bandwidth setting is used only while measuring noise powers, and is independent from the IF bandwidth setting used to measure S-parameters. Noise figure is calculated from noise power and S-parameter measurements.
The calibration and measurement should be performed using the SAME noise bandwidth. When the noise bandwidth is changed after calibration, noise figure measurements can change by 0.5 dB or more, depending on the DUT frequency range, gain, and noise figure.
M9485A, M980xA, P50xxA/B Sweep Time for Noise BW (@ Noise Average = 1)
|
Noise BW
|
Sweep Time (µsec)
|
Ratio for equivalent sampling time
|
Noise BW
|
Sweep Time (µsec)
|
Ratio for equivalent sampling time
|
Ratio for equivalent noise power repeatability
|
|
800 kHz
|
500
|
16
|
800 kHz
|
500
|
16
|
6.4
|
|
2 MHz
|
200
|
20
|
2 MHz
|
200
|
20
|
8
|
|
8 MHz
|
50
|
20
|
8 MHz
|
50
|
20
|
8
|
|
24 MHz
|
16.67
|
15
|
24 MHz
|
16.67
|
15
|
6
|
M9834A, M9837ASweep Time for Noise BW (@ Noise Average = 1)
|
Noise BW
|
Noise BW
|
Sweep Time (µsec)
|
|
800 kHz
|
800 kHz
|
500
|
|
1 MHz
|
1 MHz
|
400
|
|
2 MHz
|
2 MHz
|
200
|
|
4 MHz
|
4 MHz
|
100
|
|
8 MHz
|
8 MHz
|
50
|
|
12 MHz
|
12 MHz
|
33.3
|
|
24 MHz
|
24 MHz
|
16.67
|
Average Number Increase the number of averages to reduce jitter. This also reduces measurement speed. For maximum accuracy, use the following recommendations for the noise calibration.
During a measurement, the gain of the DUT helps overcome the noise of the VNA receivers, so the number of noise averages can be reduced to improve measurement speed with minimal or no degradation to measurement accuracy.
Select the receiver gain setting as higher as possible without "ADC overload error". The optimum receiver gain depends on the pre-amplifier gain and filter. This setting is applied in the Noise Figure power measurement only.
Note: [M983xA] High gain is not available when M983xA does not have option 029.
Only ONE gain setting can be used for the entire frequency range of your noise measurement. Therefore, it may be necessary to use two noise channels with different frequency ranges and gain settings to achieve the very highest noise figure accuracy.
Source Temperature
Note: This setting is only used for calibrated noise figure measurements, but has no effect in an uncalibrated noise figure channel. The default value is used for uncalibrated measurements.
Note: The 302 K value is based on the internal temperature of an ECal (304 K) and assumes 1.5 dB of cable loss and a room temperature of 297 K. The ambient-temperature field can still be set by the user, but the user-entered value is ignored when using VNC with an ECal (but not ignored for SNC). Starting with firmware release A.15.55.08 (Jan 2022), the ambient temperature field was renamed Source Temperature, and a check box labeled “Use 302 K for Vector Noise Cal with internal/ECal tuner” was added. When checked (the default behavior), the ambient temperature field is ignored as before when using VNC with an external ECal module . Note that if the box is checked when using an electromechanical tuner for measuring noise parameters, the default or user-entered value in the field is used. When the box is cleared, the default or user-entered value in the field is used. This allows the user to enter a value for test setups that have higher cable loss or when the testing environment is significantly hotter or colder than 297 K.
Enter the equivalent port temperature at the time of the measurement, in Kelvin (K). One can use a thermometer to measure the temperature of the input cable.
In the case of full vector correction, it is the temperature of the Ecal Tuner (31 °C or 304.15K) minus the loss effect of the cable from the tuner to the DUT; both internal and external Ecals used as tuners have the same internal heater to heat to 31 °C.
For scalar it is the temperature of the external switch attached to port 1 minus the loss of the cable, typically around 297K.
The cable loss compensation is computed from Tambient_setting=Tvna_source*|S21|^2+(1-|S21|^2)*Tcable where S21 is the loss of the port 1 or 2 cable, Tcable is the temperature of the cable, and Tvna_source is the temperature of the either the Ecal used as a tuner, for full vector, or the temperature of the external switch for scalar calibration. Tecal is typically 304.15K; the external switch is typically around 297K
This temperature number has an inverse relationship to the noise figure. When using the effective noise temperature (Te) format, a 3 degree increase in the ambient temperature will make the calibration measurement result drop 3 degrees, which will then have an effect on subsequent noise figure measurements. One can directly measure the port 1 equivalent temperature by connecting port 1 to port 2 with a low loss through, and measuring the mean value directly. Because the noise value is quite low, averaging or using trace statistics should be used to find this value.
Use 302K for Vector Noise Cal with internal/ECal tuner When checked will use 302K as the source temperature when vector correction is applied and the tuner is an ECal . When unchecked, the specified source temperature will be used.
Impedance States
Note: M9485A does not support this function.
Noise Tuner Displays the ECal module to be used as a noise tuner. Select the Noise Tuner during calibration on the Select Cal Method dialog.
Max Acquired Impedance States Select the number of impedance states in which to make noise measurements. At least FOUR impedance states are required. Learn more.
|
|
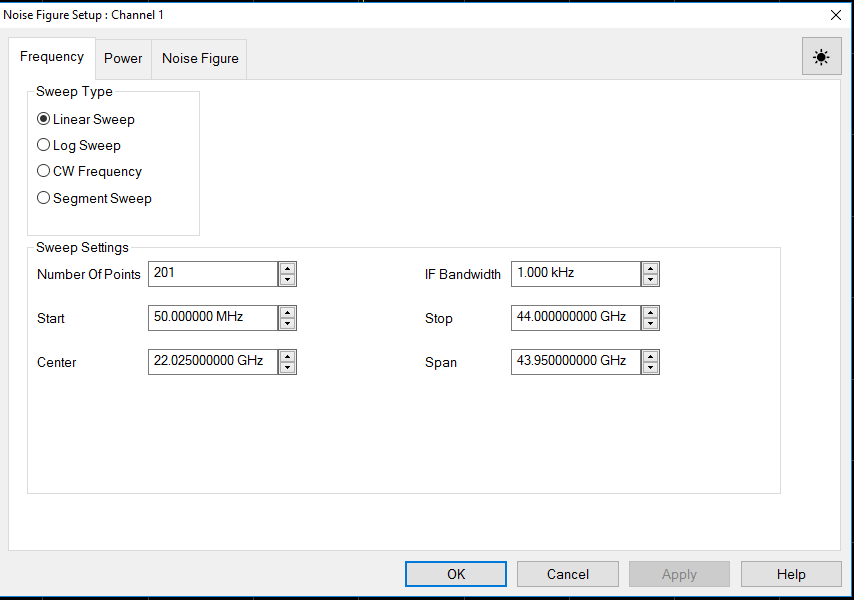
Frequency Tab - Noise Figure dialog box help
|
|
These settings can also be made from the normal VNA setting locations. Click links below to learn how.
Sweep Type
Choose a sweep type. Learn more.
Segment Sweep Notes:
Sweep Settings
Click each to learn more about these settings.
|
|
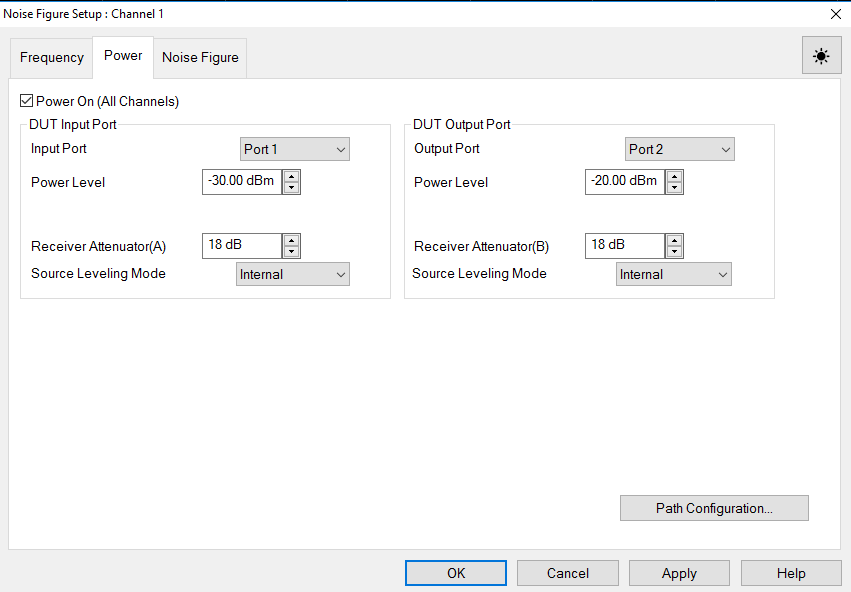
Power Tab - Noise Figure dialog box help
|
|
For M983xA
For M983xA
Note: S-parameter power settings are critical for accurate noise figure measurements. See Noise Figure Measurement Tips.
Configures RF power settings for the S-parameter measurements that occur before noise measurements. Input power to the DUT is turned OFF during noise measurements.
These settings can also be made from the normal Power setting locations.
Power ON (All channels) Check to turn RF Power ON for all channels.
DUT Input Port
Input Port - Select a VNA port to be connected to the DUT input.
Note: Input power levels are critical for accurate noise figure measurements. Learn more.
Power Level The input power to the DUT during S-parameter measurements.
Source Attenuator Auto Check to automatically select the correct attenuation to achieve the specified input power. Clear, then select attenuator setting that is used achieve the specified Power Level. Learn more about Source Attenuation.
All VNA channels in continuous sweep must have the same attenuation value. Learn more.
Receiver Attenuator Specifies the receiver attenuator setting for input port. (M938xA)
Source Leveling Mode Specifies the leveling mode. Choose Internal. Open Loop should only be used when doing Wideband Pulse measurements (not available with Noise figure measurements).
DUT Output Port
Output Port - Select a VNA port to be connected to the DUT output.
Output Power Sets power level in to the output port for reverse sweeps. Port power is automatically uncoupled. Reverse sweeps are always applied to the DUT when Full 2-port correction is applied. Enhanced Response Cal is NOT available for noise figure measurements.
Source Attenuator Specifies the source attenuator setting for reverse power.
Receiver Attenuator Specifies the receiver attenuator setting for the output port. (M938xA: Receiver Configuration)
Source Leveling Specifies the leveling mode. Choose Internal.
Path Configuration Launches the path configuration dialog. Learn More.
|
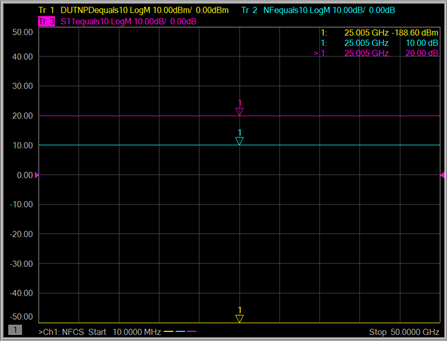
Using Noise Figure Traces in Equation Editor
In a Noise Power trace, the underlying unit is noise temperature.
10*log10( temperature * 1000mw/w * 1.38e-23)
(1.38e-23 is Boltzmanns constant)
Any time you use Equation Editor on a Noise Power trace, the LogMag formatting will apply the above equation. Therefore, first select REAL format and then generate the equation.
The following screen is an example showing three traces: DUTNPD (DUT Noise Power Density), NF (Noise Figure), and S11 with the equation set to "***=10". Note that formatting for noise figure measurements is different than noise power measurements or temperature measurements. For regular receiver power measurements, the conversion from linear magnitude to log magnitude uses 20*log10 (linear magnitude).
Radio-Frequency Electromagnetic Field Immunity
When a 3Vm-1 radio-frequency electromagnetic field is applied to an PNA with Opt 029 according to IEC 61000-4-3:1995, degradation of performance may be observed. When the frequency of the incident field matches the frequency of a measured noise figure or gain, the values displayed will deviate from those expected. This phenomenon will only affect that specific frequency, and the analyzer will continue to perform to the specification at all other frequency sample points.
The VNA with Opt 029 may be unable to calibrate a chosen frequency sample point if the frequency matches that of an incident electromagnetic field.
|